Latest News and Comment from Education

Showing posts with label STATE SCHOOL FUNDING. Show all posts

Wednesday, May 19, 2021

Education Research Report: U.S. Spending on Public Schools in 2019 Highest Since 2008

Education Research Report: U.S. Spending on Public Schools in 2019 Highest Since 2008
U.S. Spending on Public Schools in 2019 Highest Since 2008


K-12 School Spending Up 4.7% in 2019 From Previous Year


The nation spent $752.3 billion on its 48 million children in public schools in fiscal year 2019, a 4.7% increase from the previous year and the most per pupil in more than a decade.

Instructional salaries, the largest expenditure within current spending, totaled $239.9 billion in fiscal year 2019 or 31.9% of total expenditures for public elementary-secondary education.

The Census Bureau’s Annual Survey of School System Finances tables released todayshow per pupil current spending for elementary and secondary public education (pre-K through 12th grade) for all 50 states and the District of Columbia increased 5.0% to $13,187 in FY 2019 from $12,559 in FY 2018 — the largest increase since 2008.

Breaking Down School Spending

Total expenditures for elementary and secondary education include FY 2019 “current” spending, capital outlay expenditures, interest on debt and payments to other governments.

Current spending, which made up $652.3 billion or 86.7% of total expenditures in FY 2019, consists of expenses for day-to-day activities, including teachers’ salaries and benefits and most other school system daily expenses.

Capital outlay, another portion of total expenditures that includes construction, large equipment expenses and improvements to existing structures, totaled $76.3 billion or 10.1% of total expenditures.

Instructional salaries, the largest expenditure within current spending, totaled $239.9 billion in fiscal year 2019 or 31.9% of total expenditures for public elementary-secondary education.

Total expenditure increased by 4.7% while total revenue increased by 4.5% from fiscal year 2018.

Where School Funding Comes From

In FY 2019, state governments contributed the largest share of funding to public school systems: $350.9 billion or 46.7%.

Local sources of revenue were the next largest at $342.9 billion or 45.6%, and the federal government contributed the least, $57.9 billion or 7.7%.

The 2019 Annual Survey of School System Finances includes data on revenues, expenditures, debt and assets (cash and security holdings) of elementary and secondary public school systems.

Please note that the data released today were collected before the COVID-19 pandemic took hold in the United States. A preliminary report on 2020 fiscal year school finances data is scheduled to be released this fall.


Full report

Tuesday, May 11, 2021

Shanker Blog: The Great Divergence In State Education Spending | National Education Policy Center

Shanker Blog: The Great Divergence In State Education Spending | National Education Policy Center
Shanker Blog: The Great Divergence In State Education Spending


When we talk about K-12 education spending inequality, we're usually talking about differences in resources between high- and low-poverty districts within states. But spending levels also vary between states, and that too matters for overall spending inequality in the U.S. How has this changed over the past 25 years? In other words, does K-12 spending vary more between states than it did a quarter century ago?

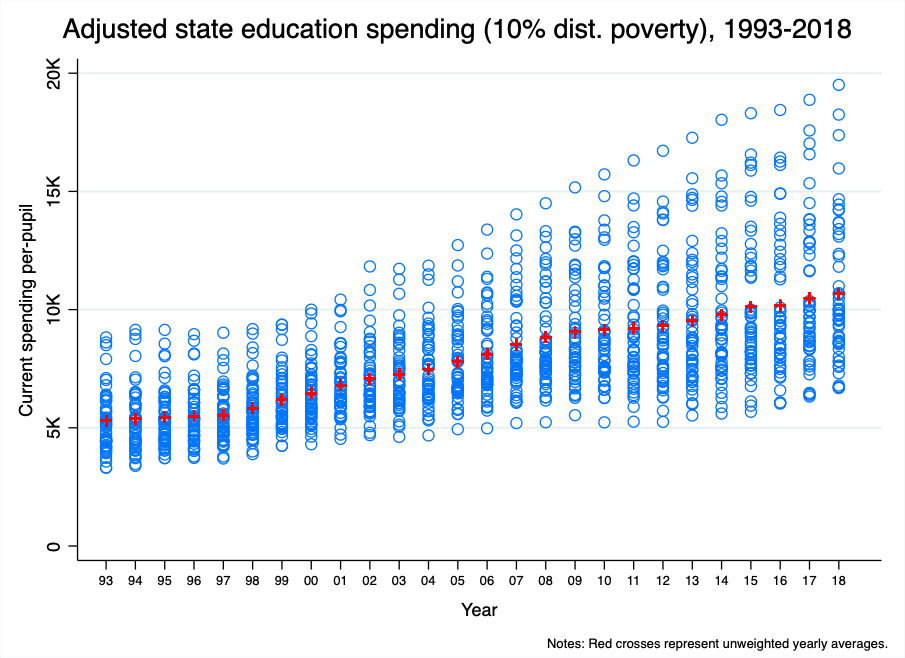
Let’s take a look at one simple way to visualize this trend. In the graph below, each blue circle is a state, and there one set of 51 states (including D.C.) for each year between 1993 and 2018 (the horizontal axis). On the vertical axis is total current spending in each state, predicted for a district in each state with a 10 percent Census child poverty rate (the graph is very similar regardless of poverty level). These spending levels also control for regional wage variation, district size, and population density, all of which affect the “value of the education dollar.” This allows for a better comparison between states (e.g., it costs more, on average, to hire teachers in Connecticut than in Alabama). The red plus signs within each year represent the unweighted average spending level across all states. These data are from the School Finance Indicators Database.

Our focus here is on the “spread” of states (blue circles) within each column (i.e., within each year). A larger spread, of course, represents greater variation (and, roughly speaking, more interstate inequality). The trend over time is a bit striking.

Throughout most of the 1990s and the first half of the 2000s, all but a small handful of states were clustered within the $3,000 to $8,000 range, a spread of about $5,000 per-pupil. Now, to be clear, this is a big span (particularly in these earlier years, when spending was lower), and it represents substantial interstate variation in spending. Even controlling for factors that affect costs, such as poverty and regional wage variation, some states spend a lot more than others.

Starting in the mid-2000s, however, a group of about 5-10 states start to break away from the CONTINUE READING: Shanker Blog: The Great Divergence In State Education Spending | National Education Policy Center