UFT elections: another look at New Action and MORE votes
We’ve already seen that votes flipped to New Action from ICE/TJC in 2010, and back to MORE in 2013.
But has the overall non-Unity vote changed? I’m hardly the first to draw this conclusion. It has changed, but not much.
Let’s start with the raw numbers:
-
Let’s examine non-Unity votes taken as a single unit:
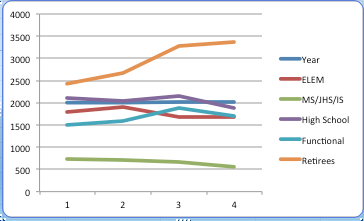
It might be hard to absorb from a table how uninteresting these numbers are. Try a graph:

The overall flatness is quite apparent. But there are some exceptions. The total number of retirees voting for a caucus other than Unity has increased in absolute terms. Both New Action and the other group(s) have benefited. A second shift, small, and hard to see in the noise, New Action has a small but real increase in votes
But has the overall non-Unity vote changed? I’m hardly the first to draw this conclusion. It has changed, but not much.
Let’s start with the raw numbers:
| Year | ELEM | MS/JHS/IS | High School | Functional | Retirees | |||||||||
| NAC | I/T/M | NAC | I/T/M | NAC | I/T/M | NAC | I/T/M | NAC | I/T/M | |||||
| 2004 | 556 | 1,239 | 311 | 422 | 700 | 1,417 | 512 | 990 | 1,558 | 872 | ||||
| 2007 | 562 | 1,337 | 273 | 444 | 521 | 1,524 | 548 | 1,032 | 1,616 | 1,061 | ||||
| 2010 | 978 | 703 | 421 | 248 | 774 | 1,369 | 1,175 | 708 | 2,234 | 1,037 | ||||
| 2013 | 534 | 1,140 | 161 | 398 | 452 | 1,430 | 754 | 951 | 1,880 | 1,490 | ||||
Let’s examine non-Unity votes taken as a single unit:
| Year | ELEM | MS/JHS/IS | High School | Functional | Retirees |
| 2004 | 1,795 | 733 | 2,117 | 1,502 | 2,430 |
| 2007 | 1,899 | 717 | 2,045 | 1,580 | 2,677 |
| 2010 | 1,681 | 669 | 2,143 | 1,883 | 3,271 |
| 2013 | 1,674 | 559 | 1,882 | 1,705 | 3,370 |

The overall flatness is quite apparent. But there are some exceptions. The total number of retirees voting for a caucus other than Unity has increased in absolute terms. Both New Action and the other group(s) have benefited. A second shift, small, and hard to see in the noise, New Action has a small but real increase in votes
