- Explore interactive and dynamic graphics that illustrate the results of the 2013 mathematics and reading assessments.
- Test yourself with actual National Assessment of Educational Progress (NAEP) questions.
- Watch videos for tips on how to explore and interpret results.
Results for 2013 NAEP Mathematics and Reading Assessments Are In
Results from the 2013 NAEP assessments show fourth- and eighth-graders making progress in mathematics and reading.
Nationally representative samples of more than 376,000 fourth-graders and 341,000 eighth-graders were assessed in either mathematics or reading in 2013. Results are reported for public and private school students in the nation, and for public school students in all 50 states, the District of Columbia, and Department of Defense schools.
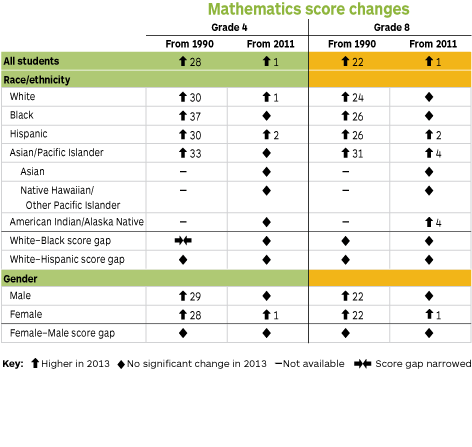
Average mathematics scores for fourth- and eighth-graders in 2013 were 1 point higher than in 2011, and 28 and 22 points higher respectively in comparison to the first assessment year in 1990.
- Hispanic students made gains in mathematics from 2011 to 2013 at both grades 4 and 8.
- Fourth- and eighth-grade female students scored higher in mathematics in 2013 than in 2011, but the scores for fourth- and eighth-grade male students did not change significantly over the same period.

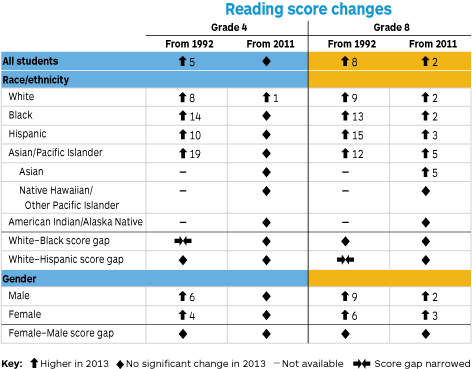
The average reading score for eighth-graders was 2 points higher in 2013 than in 2011, but the score for fourth-graders did not change significantly from 2011. Reading scores were higher in 2013 than in 1992 at both grades.
- White, Black, Hispanic, and Asian/Pacific Islander eighth-graders scored higher in reading in 2013 than in 2011.
- Both male and female eighth-graders scored higher in reading in 2013 than in 2011.

Public school students in Tennessee, the District of Columbia, and Department of Defense schools scored higher in 2013 than in 2011 in both subjects and grades.
- Mathematics scores were higher in 2013 than in 2011 at both grades in Hawaii, Tennessee, the District of Columbia, and Department of Defense schools.
- Reading scores were higher in 2013 than in 2011 at both grades in Iowa, Tennessee, Washington, the District of Columbia, and Department of Defense schools.
See more about state score changes.
NOTE: Accommodations were not permitted in NAEP mathematics assessments prior to 1996, and in NAEP reading assessments prior to 1998. Black includes African American, Hispanic includes Latino, and Pacific Islander includes Native Hawaiian. Race categories exclude Hispanic origin. Score-point changes are calculated using unrounded average scores.
SOURCE: U.S. Department of Education, Institute of Education Sciences, National Center for Education Statistics, National Assessment of Educational Progress (NAEP), various years, 1990–2013 Mathematics and Reading Assessments.
