
Changing Membership, Changing Electorate
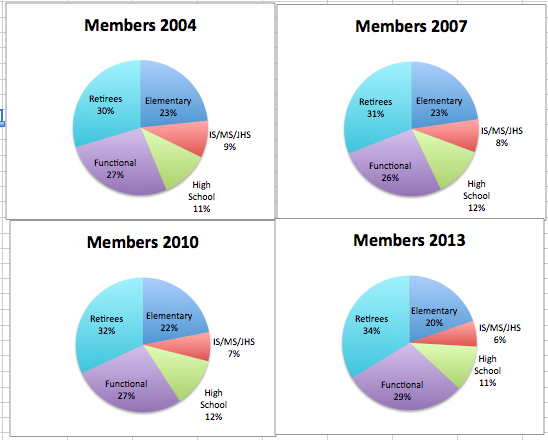
This is a time series of charts, showing UFT membership and votes by division for the 2004, 2007, 2010, and 2013 elections. I created the charts from the numbers of ballots mailed and the number of ballots returned, which has been part of the reported election results, including this year.
Raw numbers, by division, by year, with turnout percentages are included at the bottom of this post.
Members by Division, by year
Voters by Division, by Year
Raw numbers, by division, by year, with turnout percentages are included at the bottom of this post.
Members by Division, by year

Voters by Division, by Year
UFT Elections – Sitting at the Count
I arrived. Hotel meeting room, for a large meeting, set up with rows of tables with ballot counters doing something… sorting? flattening? stacking? In front were some more important looking tables. I missed the scanners and monitors – I was looking for something else.
In the back, right, were the observers. I found Joel Berger, then found Mike Shulman. They were not wearing their concern on their faces, but I felt it. Before walking out with Mike I said hi to some of the Unity people and some of the MORE people. The Unity people looked bored, and perhaps a bit tired. The MORE people were relaxed.
Mike and I found a quiet place to sit around the corner. We looked through the participation numbers… down
UFT election turnout is concerning
Reviewing data since 2004, participation in UFT elections is down across the board. In 2007 there was a drop, an uptick in 2010, and a big drop in 2010. This trend was stronger than any variation among the divisions, including retirees. Here are the percents by division, followed by the divisional data displayed as a line graph…
The same data, graphed:
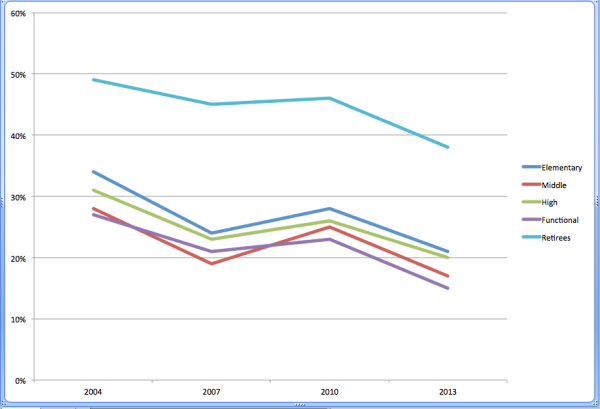
| 2004 | 2007 | 2010 | 2013 | |
| Elementary | 34% | 24% | 28% | 21% |
| Middle | 28% | 19% | 25% | 17% |
| High | 31% | 23% | 26% | 20% |
| Functional | 27% | 21% | 23% | 15% |
| Retirees | 49% | 45% | 46% | 38% |
| Subtotals | ||||
| Teachers | 32% | 23% | 27% | 20% |
| In Service | 30% | 22% | 25% | 18% |
| Total | 36% | 29% | 32% | 25% |
