Latest News and Comment from Education

Tuesday, September 6, 2016

Silicon Valley Community Foundation: Mega-Donor to Vergara and Controller of Numerous CA Nonprofits | deutsch29

Silicon Valley Community Foundation: Mega-Donor to Vergara and Controller of Numerous CA Nonprofits | deutsch29:

Silicon Valley Community Foundation: Mega-Donor to Vergara and Controller of Numerous CA Nonprofits


On August 26, 2016, I examined the 2011-2014 tax forms for the Students First Foundation (SFF), the nonprofit behind the organization, StudentsMatter, which, in turn, is the organization behind California’s recently-nixed Vergara lawsuit.
One SFF funder in particular caught my attention because of the chunk of money it sent SFF’s way in 2014:
Silicon Valley Community Foundation (SVCF): $3,191,800
SVCF (EIN 20-5205488) is located at 2440 West El Camino Real, Suite 300, Mountain View,  CA  94040.
I have been reading SVCF’s tax forms, which can be accessed here for the years 2005-2014, and I had second thoughts about downloading SVCF’s 2014 return when I saw that it is 2,970 pages long.
So much for second thoughts. Here it is: SVCF 2014 990
SVCF is a mammoth nonprofit. Here is how it describes itself:
Silicon Valley Community Foundation advances innovative philanthropic solutions to challenging social problems locally and throughout the world. Through visionary leadership and strategic grantmaking, Silicon Valley Community Foundation partners with donors and the community to strengthen the common good.
Indeed, “strengthening the common good” includes over $3 million to push Vergara.
SVCF’s 2014 beginning-of-year net assets were $3.7 billion; by the end-of year, net assets rose to $5.5 billion. Its total 2014 beginning-of-year assets (net assets plus liabilities) were $3.9 billion, and its 2014 total end-of-year assets, $5.7 billion.
Turns out that $3.6 billion of SVCF’s 2014 beginning-of-year assets come from publicly-traded securities (up to $5 billion for 2014 end-of-year).
Interestingly, SVCF listed $8 million in 2014 revenue as coming from “related organizations”– which means that SVCF is part of a network of nonprofits.
In fact, SVCF notes on its 2014 tax return that it is the “direct controlling entity” of 16 other California-based nonprofits (“supporting organizations”):
  • William H. Cilker Family Foundation
  • Driscoll Family Foundation
  • The Dirk and Charlene Kabcenell Foundation
  • The Bernard A. Newcomb Foundation
  • Raising a Reader
  • The Real Estate Trust
  • Redderre Foundation
  • Skoll Fund
  • Sobrato Foundation
  • Star Hill Fund
  • Good Ventures
  • Chong-Moon Lee Foundation
  • Intervalien Foundation
  • Innovate Public Schools
  • Startup: Education
  • Entrepreneurs’ Foundation
Here is what the SVCF website offers regarding its pitch in promoting its directly-controlled, supporting organizations:
A tax-wise alternative to a private foundation, supporting organizations allow you to hire staff and convene a board. They are far less restrictive than 
Silicon Valley Community Foundation: Mega-Donor to Vergara and Controller of Numerous CA Nonprofits | deutsch29:


Success Academy Scrubs Their Public Video Page | Gary Rubinstein's Blog

Success Academy Scrubs Their Public Video Page | Gary Rubinstein's Blog:

Success Academy Scrubs Their Public Video Page


There’s a famous saying, I think it originated with Watergate, “It’s not the crime, it’s the cover up.”
My last two blog posts have been based on videos I found on Success Academy’s public video site on Vimeo.  This is the collection of videos that they promised in The Wall Street Journal back in May after a few very public scandals.
Now Success Academy is very private about what happens in their schools so you’d figure that all their videos contain things that they are proud of.  Surely they spent considerable money producing these videos and there were many people involved in what sorts of things would be permitted to be in these videos.
There were 485 videos on the page when I first came across it a few days ago.  Randomly clicking on a few of them I found four videos among the nearly 500 that I analyzed, three in the first post and one in the second post.  I noticed in a comment today on the most recent post that the video I wrote about was taken down from the site.  Then I looked at the first post and found that two of those three videos were also removed from their site.  I went back to their site to find that all that remains of the 485 videos that were up just 24 hours ago is now down to just 56 videos.
Now you can go back and read my posts and you will see that I encourage readers to watch the videos and make their own judgements before reading my opinions on them.  Surely by posting these videos they should expect that someone might watch them and critique them, you’d figure.  But I think it is pretty sure that it isn’t a coincidence that a few days after I posted the links to these videos not only are three out of four of them removed, but over 90% of their videos are removed.
Now these videos were posted originally, presumably, to help the public schools learn what they can do to be as high performing as Success Academies.  These videos were a public service.  If this is true, it seems very harsh, cruel even, to take them down just because Success Academy Scrubs Their Public Video Page | Gary Rubinstein's Blog:

Where Students Miss the Most Class, and Why Chronic Absenteeism Is a Problem - The Atlantic

Where Students Miss the Most Class, and Why Chronic Absenteeism Is a Problem - The Atlantic:

The Long-Term Consequences of Missing School

Six million children are chronically absent, half of whom are enrolled at just 4 percent of the nation’s school districts.


The precocious teen who’s too cool for school—earning high marks despite skipping class—is a pop-culture standard, the idealized version of an effortless youth for whom success comes easy.
Too bad it’s largely a work of fiction that belies a much harsher reality: Missing just two days a month of school for any reason exposes kids to a cascade of academic setbacks, from lower reading and math scores in the third grade to higher risks of dropping out of high school, research suggests.
A new analysis of federal data shows that the problem of chronic absenteeism is both widespread and concentrated. Of the more than 6 million students who are chronically absent, half attend just 4 percent of the nation’s school districts and 12 percent of the nation’s schools. Nearly nine in 10 districts report chronically absent students, based on data from the 2013-14 school year, a figure that some experts believe is an undercount. The report defines chronic absenteeism as missing at least 15 school days each year, which is roughly 10 percent of the academic calendar.
Pinpointing the students who miss school that often is crucial, said Hedy Chang, a co-author of the report and the director of the advocacy group Attendance Works. “Is the issue that kids are coming to class but they're not learning, or is the issue that there's so much chronic absence that kids are missing out on the instruction, and not learning?” she asked during a call last week with reporters.

Robert Balfanz, the other co-author of the report and the director of the Everyone Graduates Center at Johns Hopkins University, said districts with high levels of chronic absenteeism are located in diverse settings, from large urban centers and affluent suburbs to small post-industrial towns and rural enclaves. “We have to know where we have to go to find these kids who are chronically absent, and tailor our approach to the situation,” he said. “A big benefit of this report is it helps us understand the contours of chronic absenteeism.”
In the Philadelphia school district, 37 percent of the system’s 144,000 are chronically absent. Among high-school students, the figure shoots up to 51 percent. The districts in Baltimore and Milwaukee have similar numbers. For Cleveland and Detroit, the chronic absenteeism rates are around 50 percent, and more than 60 percent of Cleveland’s high-schoolers missed more than three weeks of school a year.

The report’s authors write that one common denominator linking these cities is the “nearly 100 years of historical actions that aimed to segregate African American populations in sections of the city with the poorest housing, greatest proximity to industrial pollutants, greatest exposure to violence, and highest unemployment rates, resulting in widespread inter-generational poverty.”

Tyrone Howard, an associate dean of inclusion and an education professor at the University of California, Los Angeles, said in an email that “chronic absenteeism is typically one of the most ardent signs that something serious may be happening with a student and his or her family.” He noted that students who skip school may be caring for younger siblings, experiencing neglect or homelessness—a plight endured by 1.3 million U.S. students—or facing related traumas.

“Such episodes can lead to students avoiding school for long periods of time,” he added.

Some districts with high levels of chronic absence have more resources than others. Chang and Balfanz’s research shows that affluent suburban districts, such as those in Fairfax County, Virginia, and Montgomery County, Maryland, post some of the highest absenteeism numbers in the country, likely as a result of their growing low-income populations, though the communities’ wealth can provide the financial backstop to support students who are missing too much class. In fact, recent reporting from U.S. News & World Report found that some rich suburban districts receive more federal aid for low-income students than smaller but far poorer districts.

Also at risk are the hundreds of thousands of students in smaller, post-industrial cities, “places like Utica, Schenectady, and Albany in New York, and Syracuse and Buffalo, all of them have very high rates of chronic absenteeism, often topping 50 percent, and they all often have very high rates of concentrated poverty," said Balfanz. "That's part of the challenge, that many states have these sort of economically and socially isolated cities spread out across the state."
The economic malaise of these cities rarely receives national attention, argued Paul Jargowsky, a Rutgers University professor, at an Education Writers Association seminar in Chicago last fall on poverty and education.

UCLA’s Howard joins other scholars in advocating for more social workers and psychologists on school campuses to address the factors that may drive chronic absenteeism. An NPR story recently spotlighted a principal in St. Louis who acquired several free washers and dryers after learning some students avoided school because they lacked clean clothing.

Other researchers and school leaders point to districts collaborating with local charities or agencies to address chronic absenteeism. The Nashville school Where Students Miss the Most Class, and Why Chronic Absenteeism Is a Problem - The Atlantic:


Black Teachers Matter | Mother Jones #EDUCOLOR

Black Teachers Matter | Mother Jones:

BLACK TEACHERS MATTER


America’s schools desperately need educators like Darlene Lomax. So why are we driving them away?

One spring morning this year, Darlene Lomax was driving to her father's house in northwest Philadelphia. She took a right onto Germantown Avenue, one of the city's oldest streets, and pulled up to Germantown High School, a stately brick-and-stone building. Empty whiskey bottles and candy cartons were piled around the benches in the school's front yard. Posters of the mascot, a green and white bear, had browned and curled. In what was once the teachers' parking lot, spindly weeds shot up through the concrete. Across the street, above the front door of the also-shuttered Robert Fulton Elementary School, a banner read, "Welcome, President Barack Obama, October 10, 2010."

It had been almost three years since the Philadelphia school district closed Germantown High, and 35 years since Lomax was a student there. But the sight of the dead building, stretching over an entire city block, still pained her. She looked at her old classroom windows, tinted in greasy brown dust, and thought about Dr. Grabert, the philosophy teacher who pushed her to think critically and consider becoming the first in her family to go to college. She thought of Ms. Stoeckle, the English teacher, whose red-pen corrections and encouraging comments convinced her to enroll in a program for gifted students. Lomax remembers the predominantly black school—she had only one white and one Asian American classmate—as a rigorous place, with college preparatory honors courses and arts and sports programs. Ten years after taking Ms. Stoeckle's class, Lomax had dropped by Germantown High to tell her that she was planning to become a teacher herself.


A historic Georgian Revival building, Germantown High opened its doors in 1915 as a vocational training ground for the industrial era, with the children of blue-collar European immigrants populating its classrooms. In the late 1950s, the district added a wing to provide capacity for the growing population of a rapidly integrating neighborhood.


By 1972, Lomax's father, a factory worker, had saved up enough to move his family of eight from a two-bedroom apartment in one of the poorest parts of Philadelphia into a four-bedroom brick house in Germantown. Each month, Darlene and her younger sister would walk 15 blocks to the mortgage company's gray stucco building, climb up to the second floor, and press a big envelope with money orders into the receptionist's hand. The new house had a dining room and a living room, sparkling glass doorknobs, French doors that opened into a large sunroom, an herb garden, and a backyard with soft grass and big trees. Darlene and her father planted tomatoes and made salads with the sweet, juicy fruit every Friday, all summer long.


To the Lomax children, the fenceless backyard was ripe for exploration, and it funneled them right to the yards of their neighbors. One yard belonged to two sisters who worked as special-education teachers—the first black people Darlene had met who had college degrees. As Lomax got to know these sisters, she began to think that perhaps her philosophy teacher was right: She, too, could go to college and someday buy a house of her own with glass doorknobs and a garden. She graduated from Rosemont College in 1985, and after a stint as Black Teachers Matter | Mother Jones:

DIVIDED AMERICA: In recovery, many poor schools left behind | State and Regional | herald-review.com

DIVIDED AMERICA: In recovery, many poor schools left behind | State and Regional | herald-review.com:

DIVIDED AMERICA: In recovery, many poor schools left behind


WAUKEGAN, Ill. (AP) — Consider Waukegan and Stevenson, two Illinois school districts separated by 20 miles — and an enormous financial gulf.
Stevenson, mostly white, is flush with resources. The high school has five different spaces for theater performances, two gyms, an Olympic-size pool and an espresso bar.
Meanwhile Waukegan, with its mostly minority student body, is struggling. At one school, the band is forced to practice in a hallway, and as many as 28 students share a single computer.
___
EDITOR'S NOTE — This is part of Divided America, AP's ongoing exploration of the economic, social and political divisions in American society.
___
Last year, Stevenson spent close to $18,800 per student. Waukegan's expenditure? About $12,600.
And the gap has only been getting wider — here in the suburbs north of Chicago, and in many places across the nation. In the years following the 2008 financial crisis, school districts serving poor communities generally have been hit harder than more affluent districts, according to an Associated Press analysis of local, state and federal education spending.
The result has been a worsening of America's rich schools, poor schools divide — and its racial divide, because many poor districts are also heavily minority. It also perpetuates the perception that the system is rigged in favor of the haves, at the expense of the have-nots — a major driver of America's angst in this election year.
The AP found that aid to local districts from the federal government surged after the economic downturn, as part of the stimulus, but then receded. Schools were left to rely more on state funding that has not bounced back to pre-recession levels. And poorer districts that cannot draw on healthy property tax bases have been left in the lurch.
The effects vary widely across the 50 states. Each has its own unique funding formula.
For example, per-pupil spending in poorer Missouri districts fell behind richer districts in 2013 — the first time in a well over decade.
Most rich districts have seen a steady increase in revenue while poorer districts — such as Louisiana RII, a predominantly white district 80 miles northwest of St. Louis — have seen cuts since 2010. That rural district has started waiting longer to replace textbooks, and it will likely abandon initiatives to distribute new computers and to bring wireless internet into classrooms. Todd Smith, the superintendent, said the district will likely seek a tax increase or a bond sale because there isn't enough money for basic maintenance.
"We find ourselves more and more dipping into our reserves," Smith said.
In Connecticut's largest city, Bridgeport, schools have struggled with cuts in state and federal grants, Superintendent Frances Rabinowitz said. And the gap widens between her district and neighboring, affluent Fairfield County towns with smaller class sizes and students with far fewer needs.
The result? No aides for kindergarten classrooms, or guidance counselors for elementary schools.
"I feel like I am cutting the lifeblood of the system," said Rabinowitz, whose schools are more than 80 percent black or Hispanic.
The impact can be long-lasting, researchers say. A study for the nonprofit and non-partisan National Bureau of Economic Research tracked students enrolled in districts where there was a prolonged increase in school funding.
Students educated in flush times finished more years of school, were less likely to live in poverty as adults, and made about 7.25 percent more in wages.
The widening funding gap that favors richer schools in Illinois is an extreme example.
For schools in the poorest 25 percent of Illinois districts, as measured by child poverty rates, per-pupil funding stalled at around $13,500 in 2014, the most recent year for which full data are DIVIDED AMERICA: In recovery, many poor schools left behind | State and Regional | herald-review.com:
Image result for big education ape corp weapons
 Image result for big education ape starving schools to death

State board poised to take new direction in school accountability | EdSource

State board poised to take new direction in school accountability | EdSource:

State board poised to take new direction in school accountability

Image result for it's hard being green


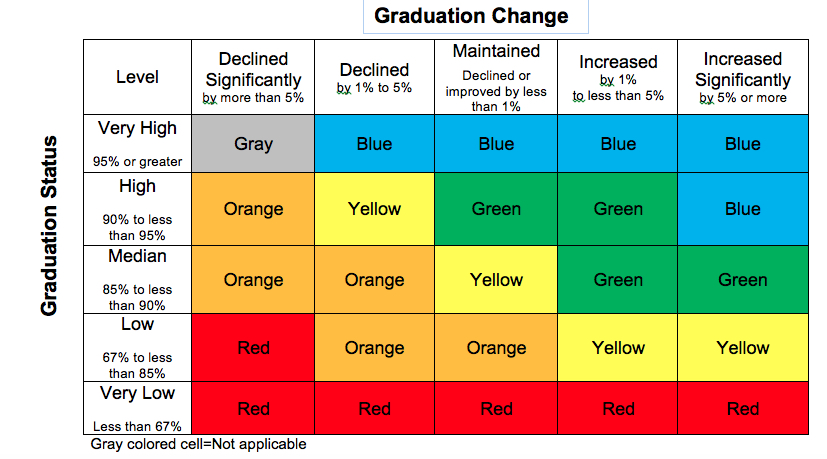
The proposed benchmarks for the high school graduation rate indicator show the interplay between the current year's performance, listed vertically, and the improvement or decline over the past three years. A high school that graduated between 85 and 90 percent of its students in the latest year, in the middle level, could be rated orange (the second lowest ranking) or green (second highest), depending on how much it improved or slipped over the past three years. High schools or districts that rank red would receive technical assistance.
CALIFORNIA STATE BOARD OF EDUCATION
The proposed benchmarks for the high school graduation rate indicator show the interplay between the current year’s performance, listed vertically, and the improvement or decline over the past three years. A high school that graduated between 85 and 90 percent of its students in the latest year, in the middle level, could be rated orange (the second lowest ranking) or green (second highest), depending on how much it improved or slipped over the past three years. High schools or districts that rank red would receive technical assistance.

After months of drafting, revising and debating how best to measure and improve schools, the State Board of Education this week will adopt key elements of a new and distinct school accountability system.
The series of votes on Thursday will meet the Legislature’s Oct. 1 deadline and will mark 2½ years since the state board suspended its simpler predecessor, the Academic Performance Index. The board expects to change components of the system in coming years.
The new system shifts from a one-dimensional school rating under the API and the federal No Child Left Behind Act, based on test scores, toward a broader picture of what constitutes a quality education. It combines measures of underlying conditions, ­such as teacher qualifications and student suspension rates, and academic outcomes, including gauges of college and career readiness and standardized test scores.
A multi-dimensional system that includes some hard-to-quantify measures like school climate is, by nature, complex, and some parent groups and advocates of  test-score focused accountability are urging the adoption of a summative ranking, like the API’s numerical rating, that is understandable at a glance.
“As parents and community leaders throughout California, we call on our public officials to give families a clearer school rating system that includes an overall assessment of school quality in addition to the currently proposed multiple measures,” reads a petition that the Los Angeles-based nonprofit Families in Schools is circulating.
The staff of the state board is wrestling with how to display on a one-page report card multiple measures of performance that include an “equity report” with results of subgroups of students. Stung by criticisms of early drafts, the board has farmed out the design to the consulting agency WestEd. A new online display won’t be ready until January.
But unless the federal government forces states to adopt a single rating, the board will use a dashboard of data. The board believes that will better enable the public to understand their schools and hold them accountable. And it will highlight achievement gaps that a single rating would gloss over. “A single number is not sufficient to evaluate an employee or buy a house. Similarly, we shouldn’t depend on just one indicator to understand school performance,” board President Michael Kirstwrote in an EdSource commentary last week.
With multiple measures, the board is following the Legislature’s orders. In the Local Control Funding Formula, legislators set eight priorities that school districts must address. They include implementing academic standards, involving parents in school decisions, creating an engaging school climate and raising student achievement. The Legislature left it up to the board to figure out how to measure progress in all eight priorities, and determine which low-performing districts need help.
That’s the overview. Here are some details; additional information can be found in the board’s agenda.

WHAT WILL THE BOARD ADOPT ON THURSDAY?

Called evaluation rubrics, it’s an accountability tool with several components:
  • A set of statewide and district performance indicators measuring the eight priorities identified by the funding formula.
  • Benchmarks that define levels of performance by districts, schools and student subgroups for each state indicator. For example, high schools that suspended more than 10 percent of their students last year and failed to reduce their rate over the past three years would be in the lowest level.
  • Criteria for determining which low-performing school districts would need technical help from a county office of education and which would State board poised to take new direction in school accountability | EdSource:


Teachers unions launch ads criticizing political spending by charter advocates | 89.3 KPCC

Teachers unions launch ads criticizing political spending by charter advocates | 89.3 KPCC:

Teachers unions launch ads criticizing political spending by charter advocates

127085 full
Leaders of California's largest teachers union have launched a new ad campaign, but this time they're not battling for hearts and minds on school policy. They're competing against charter school advocates to get politicians elected to office — with some schoolyard name calling.
In the months leading up to the June primary, the two largest charter school groups spent more than $10.4 million in "independent expenditures" on fourteen races — the most they have spent in this type of political influence in any election cycle since at least 2002.
The spending was an overt strategy to influence primary races.  And it was aided by several major donors, including philanthropist Eli Broad who gave more than $1 million dollars. Among the other wealthy donors are Netflix CEO Reed Hastings and Wal-Mart heirs Alice, Jim and Carrie Walton.
The ad campaign the union launched in response last week, dubbed "Kids Not Profits," denounces these contributions; one radio spot claims rich donors are "paying to push their agenda on the rest of us."
"These are very deep pockets," California Teachers Association president Eric Heins said.
The union has only spent $236,000 so far this election season, on two state legislative races, according to data from the Secretary of State's office.
But charter advocates said unions are being hypocritical.
"They have historically, significantly outspent what you have seen us spending thus far in this cycle, for example," said Gary Borden, executive director of the California Charter Schools Association's political arm, CCSA Advocates. "The notion that [the unions] don’t have the capacity to spend significantly in these races is, I think, certainly a fallacy."
The teacher's union is certainly a juggernaut in Sacramento politics, commonly ranking among the biggest campaign donors. But there's conflicting evidence about whether charter school backers have mustered the money to unseat CTA from this perch.
The union is right that charter groups have spent more in 2016 on independent expenditures — that is, spending on a race by an outside group that isn't coordinated with the affected candidates. It is also true that the union has donated much more in direct contributions to candidates and causes than charter school advocates have.
The two most active pro-charter groups, EdVoice and the California Charter Schools Association, have together given around $475,000 in direct contributions to candidates, campaigns or other political action committees this year. The CTA has contributed around $1.6 million in direct contributions in 2016. Its smaller counterpart, the California Federation of Teachers, has made around $880,000 in contributions.
In 2013 and 2014, the two teachers unions contributed more than $21.7 million to campaigns. They also spent $7.5 million in 2014 through an independent expenditure committee the CTA set up specifically to support their favored candidate for state schools superintendent, Tom Torlakson.
Borden said CCSA Advocates made a strategic decision to spend heavily during the primary races — especially in state legislative campaigns — because they feared a Teachers unions launch ads criticizing political spending by charter advocates | 89.3 KPCC:

Inside the California border town where one-third of students are homeless | Fusion

Inside the California border town where one-third of students are homeless | Fusion:

Inside the California border town where one-third of students are homeless

It’s sunny and dusty and hot on this nearly-barren strip of land to the south of San Diego. From the top of every little incline here you can see thousands of houses on Tijuana’s hillsides, and an enormous Mexican flag waving in the wind. If it weren’t for the 20-foot-tall wall made of rusted metal and concrete cutting off one country from the other, you might think you were in Mexico.
Veronica Medina, the student and family services manager for the San Ysidro School District, is doing what she normally does before the school year starts: driving around in her large Ford pickup truck down long stretches of road and touching base with some of the thousands of families who live in this district. As many as one-third of the kids in San Ysidro’s eight middle and elementary schools are homeless. Despite the seriousness of her job, Veronica is always smiling and laughing, making jokes with the families she encounters. She’s 42, she’s lived here for nearly her whole life, and she seems to have learned that when things are so dire, they could use a little levity.
We pass gas stations and used car dealers, then a small airport for private jets. We turn onto a dirt road towards a sprawling junkyard. The carcasses of cars and trucks stretch in every direction, separated by corrugated metal walls demarcating the boundaries of the several junk companies that operate here. Veronica snakes through the maze of lots, passing security guards looking suspiciously at her truck. She’s trying to find a family that lives here. But she can’t find them. They move lots frequently. She’s about to give up when we’re stopped by a security guard. He tells Veronica in Spanish that the family no longer lives here.
“These students are invisible. They blend in, their families are afraid to come forward, especially if they’re undocumented.”
Veronica dials up a number she has saved in her cell phone and Jennifer Gutierrez picks up. Gutierrez, her husband, and her 13-year-old daughter do indeed live in one of the lots. Later, I find out why: The going rate for a two-bedroom apartment in the San Diego area is about $1,300, plus her husband’s mom is sick back in Mexico, so they have to live there to save money. Gutierrez cleans houses a few days a week, but her hours were cut recently. Her husband works at the junkyard crushing cars. Both are undocumented. It’s hard to find better work. They keep their daughter occupied with dance lessons (salsa) and school (she’s an A student). The plan is to wait until their daughter gets a little older and more independent, maybe a year from now, and then start working one or two more jobs so they can save for a real apartment. But for now, this is fine. The trailer has a stove, a refrigerator, a little table for dinner and homework. It’s their mini house; it’s their home.
Veronica asks if we can come to their lot, but Gutierrez says the junkyard will kick them out if they find out anyone from the government (Veronica) or a reporter (me) is there—it’s happened before to another family. So over the phone Veronica reminds Gutierrez that school starts tomorrow, tells her there’ll be an event on Saturday where parents can pick up free backpacks and other school supplies, and turns her truck around.
The visit takes about 20 minutes. Veronica’s hoping to do a couple dozen more before school starts. She can’t visit all of her families, though, because in this school district of about 5,000 students, roughly 1,600 are homeless.
The problems of the San Ysidro school district are in some ways completely unique. San Ysidro is technically a part of San Diego, but it might as well be a separate city. The center of San Diego is about a 30-minute drive away, and its poverty rate is about half of San Ysidro’s. The two cities share little in the way of culture, architecture, or infrastructure. San Ysidro feels closer to Mexico than San Diego, which makes sense, since it’s literally as close as you can get to Mexico without being inside of it. The San Ysidro border crossing is the world’s busiest, with about 30 million crossings a year, and more than 90% of its approximately 30,000 residents are Hispanic.
In other ways, this place is like a lot of places in the U.S.: Since the Great Recession, student homelessness has doubled, Inside the California border town where one-third of students are homeless | Fusion: