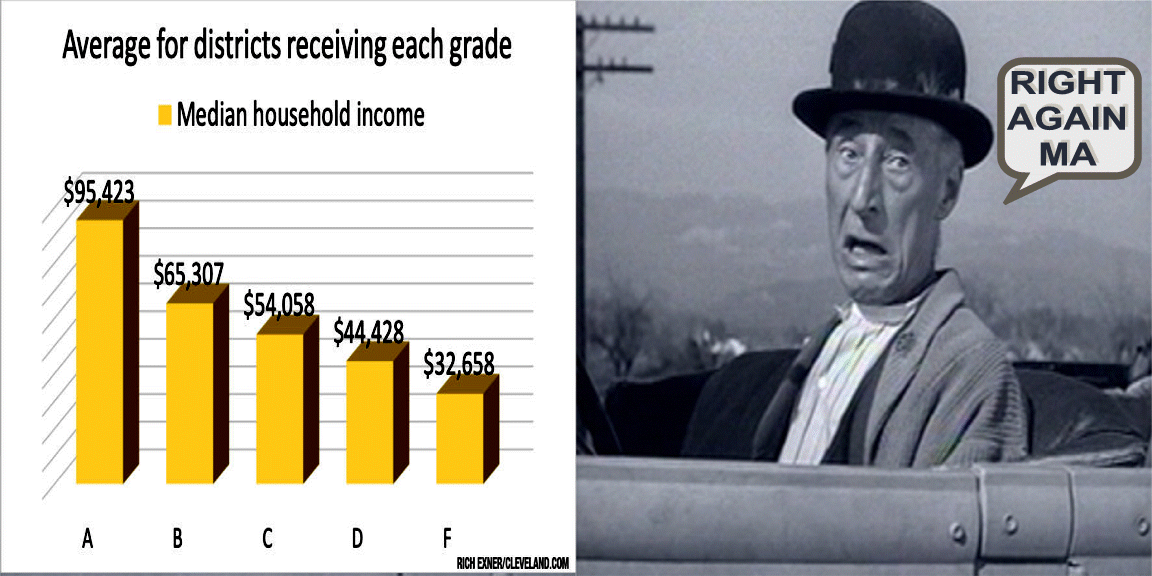
See how closely Ohio school report card grades trend with district income
CLEVELAND, Ohio - The latest set of Ohio school report cards not only provided a scorecard for each district statewide - they once again drove home the point that wealthier districts do better on such reports.
For example, incomes in the "A" districts were three times higher than those in the "F" districts, and the child poverty rate was 13 times higher in the worst performing districts, cleveland.com found.
To get an idea of how closely report card grades from the Ohio Department of Education follow demographic factors, cleveland.com compared those grades to U.S. Census Bureau community data for household income, child poverty and the education level of the adults.
In nearly every key report card category, the trends followed census data closely.
For example, taking the median household income for each district, the average among those getting "A" overall grades was $95,423. It was $65,307 for B-graded districts, $54,058 for C-graded districts, $44,428 for D-graded districts and $32,658 for F-graded districts.
In the A districts, 58.5% of the adults age 25 and older have at least a bachelor's degree. That share drops to 17.1% for D-graded districts and 16.3% for F-graded CONTINUE READING: See how closely Ohio school report card grades trend with district income - cleveland.com
Big Education Ape: CURMUDGUCATION: OH: Meaningless School Grades And Money - http://bigeducationape.blogspot.com/2019/09/curmudgucation-oh-meaningless-school.html


