

Executive Summary: Every Kid Counts
California’s elementary school truancy crisis is a persistent problem that limits the potential of California’s children and costs school districts and the state billions of dollars each year. High rates of absenteeism interfere with students’ right to an education under the California Constitution. They drive crime and incarceration, and hurt our economy. And most importantly—they put California’s most vulnerable students at a lifelong learning disadvantage.
If every kid in California counts, then we must count every kid. While we can—and should—invest in programs to improve our schools, these benefits will never reach students who do not even make it to class. California must make it a priority to improve elementary school attendance in order to fulfill the promise of the state’s new Local Control Funding Formula (LCFF), to improve educational outcomes for all students, and to help our children compete in California’s global economy.
In School + On Track 2013
Attorney General Kamala D. Harris’s first statewide report on elementary school truancy and chronic absence, In School + On Track 2013, revealed that elementary school students who miss school are more likely to struggle academically1 and eventually to drop out of school altogether.2 Dropouts cost the state more than $46 billion dollars each year,3 including more than $1 billion in juvenile crime costs alone.4 Above all, districts and counties may not realize the true scope of their attendance problems because chronic absence is masked by an insufficient statewide infrastructure for tracking attendance in California.5
In School + On Track 2014
In School + On Track 2013 highlighted the unacceptable rates of elementary school truancy using attendance records from the 2011-2012 school year. This year’s report indicates that those rates were not isolated or unique—truancy rates are persistent in California. In the 2012-2013 school year, the school year immediately preceding last year’s report, 1 in 5 elementary school students were truant, or 744,085 students. This marks an increase of 1.2% from 2011-2012.6 Because California takes an entire year to release its official truancy figures, official truancy rates are only available for years that predate the 2013 report.
This year, due to a partnership with Aeries Student Information System, we have access to new estimated rates of absenteeism for disadvantaged student populations from the 2013-2014 school year.7 The findings from this research are alarming.
According to estimates based on a sample of California school districts, over 250,000 elementary school students were chronically absent in 2013-2014—defined as missing 10% or more of the school year, adding up to roughly 18 or more school days.8 Even more troubling, over 50,000 elementary students were chronically truant, and over 40,000 missed at least 36 days of school in one year.9 Absences are also highest in the earliest years of school most critical for developing foundational skills like reading. As was true in In School + On Track 2013, we can only estimate these more severe indicators of attendance problems because California does not collect information on students’ total absences, chronic absenteeism, or chronic truancy.
Income & Racial Disparities
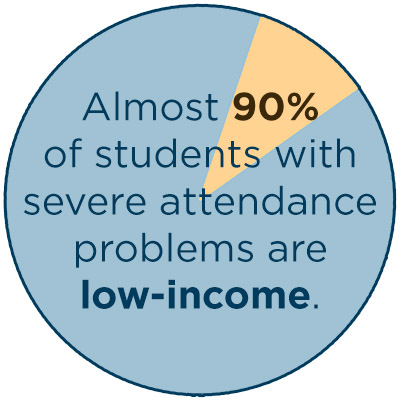
Almost 90% of the elementary students with the most severe attendance problems—those who miss 36 days or more of school per year—are estimated to be low-income. And 1 in 10 low-income students missed 10% or more of the 2013-2014 school year. These students have rightfully been targeted for increased resources under LCFF, and improving their attendance is an important step to advancing their educational opportunity.
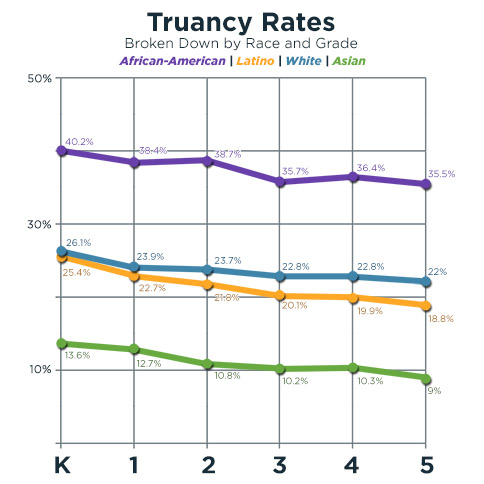
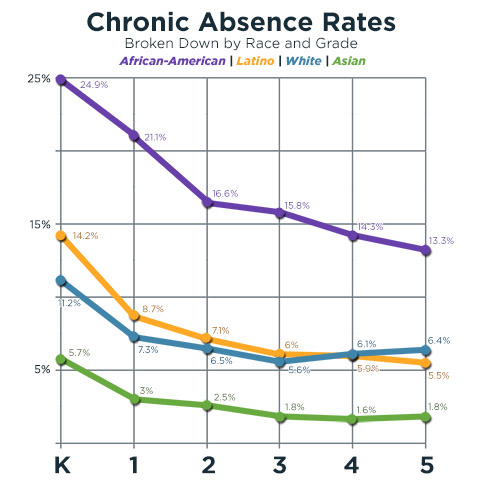
Racial disparities in attendance are particularly troubling. Thirty-seven percent of African American elementary students sampled were truant, the highest of any subgroup (including homeless students) and 15 percentage points higher than the rate for all students. Taken statewide, almost 73,000 African American elementary students are estimated to have been truant in the 2013-2014 school year. Nearly 1 in every 5 African American elementary school students—over 33,000 in total—missed 10% or more of the school year, a rate over two and a half times that of white students in 2013-2014. Most troublingly, African American elementary school students are chronically truant at nearly four times the rate of all students, and are more than three times as likely to miss 36 days of school or more per year. Moreover, absences are highest during the most important years when children learn to read, an important benchmark for long-term academic success and predictor of dropout rates.
Because the state is not collecting this critical information, the attendance crisis among African American children has largely remained hidden. Therefore, we cannot conclusively explain the stark contrast between African American elementary students’ rates of absence and that of nearly every other subgroup. We do know, however, that African American children experience many of the most common barriers to attendance—including health issues, poverty, transportation problems, homelessness, and trauma—in greater concentration than most other populations. We discuss these barriers in more detail in Chapter II.
This attendance disparity must be a wake-up call for local and state policymakers. We need not, and should not, accept these figures as inevitable. This is a solvable problem. If local agencies have the information necessary to illuminate these patterns, they can direct resources to the students and families that need the most. In Chapter II, we highlight innovative models for engaging and empowering communities of color and other disadvantaged populations to resolve barriers to attendance.
Truancy Rate
3+ unexcused absences/tardies
3+ unexcused absences/tardies
Chronic Absence Rate
18+ missed days for any reason
18+ missed days for any reason
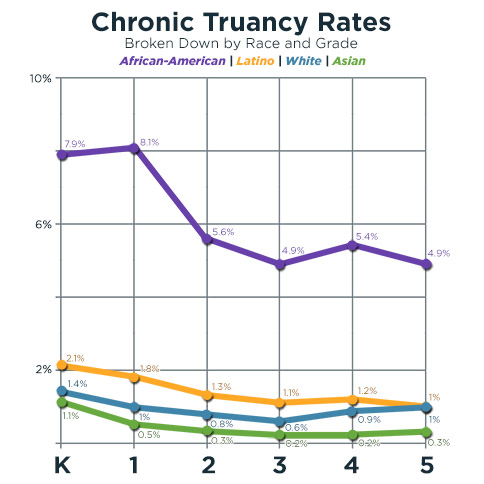
Chronic Truancy Rate
18+ unexcused absences
18+ unexcused absences
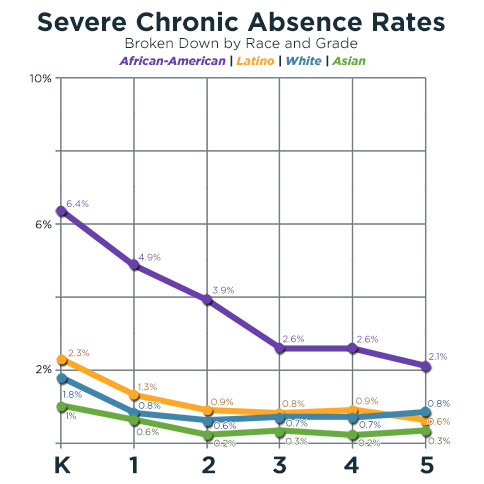
Severe Chronic Absence Rate
36+ missed days for any reason
36+ missed days for any reason
Other at-risk students also display troubling patterns of absenteeism. In grades K-6, 30% of homeless students in the sample were truant in 2013-2014, and approximately 15% missed 18 or more days of school. Finally, truancy and chronic absence rates for American Indian and Alaska Native students are similar to those for African American students, but the smaller sample size for this population has led to less consistency in the rates observed. Latinos are also more likely to be chronically absent than White students, though they suffer from less of a disparity than that observed for African Americans.Truancy 2014 - Executive Summary | State of California - Department of Justice - Kamala D. Harris Attorney General: