
Data and thoughts on public and private school funding in the U.S.
Stronger than the Scorn: How do NJ schools really stack up?
Posted on June 3, 2014
0
This is my end of school year review for New Jersey schools. Indeed much of the data in this post is from years prior. Nonetheless, these data affirm a long standing strong position of New Jersey schools either in the U.S. or international context. On many occasions I’ve pointed out better and worse uses of national and international assessment data – of Mis-NAEPery and PISA-Palooza… wherein the media and punditocracy go wild with gross misrepresentations and misinterpretationsof relatively limited albeit not entirely useless assessment data.
In New Jersey, we’ve been told in recent years that while our average scores remain high, we must not rest on our laurels, because our gains pale by comparison to reformy standout states like Tennessee. We’ve been told that while our average performance is high, our gaps in achievement are among the largest in the nation and certainly not improving at any reasonable rate. We’ve also been told that these findings provide strong proof that all the money New Jersey has thrown at schools in response to years of litigation over school funding has not only been unhelpful, but that the additional funding to high poverty settings has actually caused harm. As such, the way to repair that harm is to reduce funding to high need settings and redistribute those harmful resources across other, less needy districts likely to use it more wisely (yeah… really… they did say that… and they’ve followed through on that redistribution plan!) And that will help fix the achievement gap!
But what really is the state of student outcomes in New Jersey, if we apply a few basic principles to the analysis of NAEP data – guidelines I have addressed in numerous previous posts:
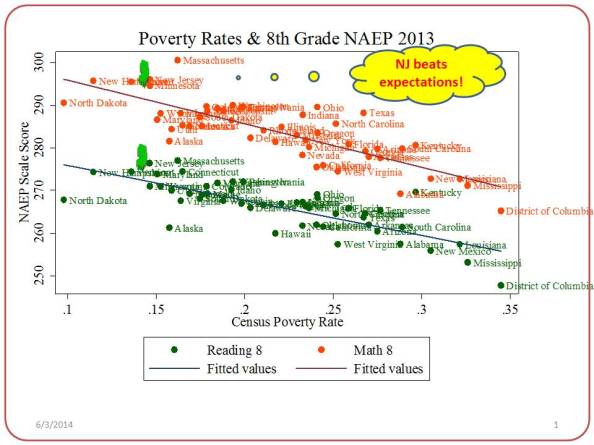
- First, average state contexts differ and those differences strongly influence average NAEP scores at all grade levels. In short, poverty matters! As such, performance Stronger than the Scorn: How do NJ schools really stack up? | School Finance 101: