
California's long-awaited School Dashboard debuts
The California School Dashboard, a website with multicolor displays rating schools and districts on a range of performance measurements, went live today.
Years in planning, the website broadens the concept of a successful school from a single metric – standardized test scores – to multiple indicators measuring academic achievement, school climate, student engagement and other priorities specified in the Local Control Funding Formula. The State Board of Education said the website is intended to provide data for school improvement as well as information for parents and the public.
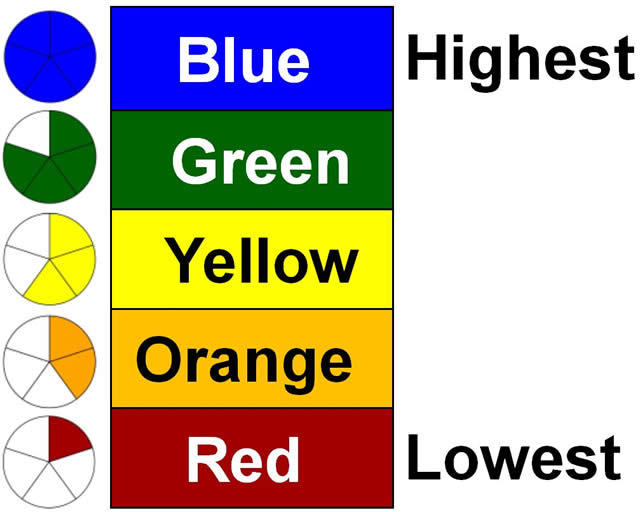
To emphasize the priority of addressing achievement gaps, the dashboard’s home page, called the Equity Report, highlights a school’s or district’s low-performing students from among a dozen subgroups that include low-income students, English learners, students with disabilities and other racial and ethnic groups. Performance levels are shown as one of five colors, from red, signifying the lowest performance, to blue, the highest level of achievement. Orange, yellow and green are in between (see note below**).
The dashboard doesn’t provide statewide averages for any indicator or an overall ranking of a school or district. That was the deliberate decision of the state board and a departure from the previous Academic Performance Index or API, which assigned a number between California’s long-awaited School Dashboard debuts | EdSource:
California Accountability Model & School Dashboard

Reports
California School Dashboard Report 
The Dashboard contains reports that display the performance of local educational agencies (LEAs), schools, and student groups on a set of state and local measures to assist in identifying strengths, weaknesses, and areas in need of improvement.
The Dashboard contains reports that display the performance of local educational agencies (LEAs), schools, and student groups on a set of state and local measures to assist in identifying strengths, weaknesses, and areas in need of improvement.
California Model Five-by-Five Grid Placement Reports
California's new accountability and continuous improvement system is based on a five-by-five colored table that produces 25 results using five colors. The reports display the schools' (by district) and student groups' placement on the five-by-five colored tables.
California's new accountability and continuous improvement system is based on a five-by-five colored table that produces 25 results using five colors. The reports display the schools' (by district) and student groups' placement on the five-by-five colored tables.
Overview
California School Dashboard Video (Video; 5:25)
This video provides an overview of California's new multiple measures accountability system. It describes the measures in the new Dashboard Report and how performance and improvement are used to determine the performance colors.
This video provides an overview of California's new multiple measures accountability system. It describes the measures in the new Dashboard Report and how performance and improvement are used to determine the performance colors.
- California School Dashboard Video (Spanish) (Video; 6:08)
Background
Based on the Local Control Funding Formula (LCFF), which was passed in 2013, California has a new accountability system that is based on multiple measures. These measures are used to determine local educational agency (LEA) and school progress toward meeting the needs of their students. The measures are based on factors that contribute to a quality education, including high school graduation rates, college/career readiness, student test scores, English learner (EL) progress, suspension rates, and parent engagement.
The sweeping overhaul of California's Accountability and Continuous Improvement System, ushered in with the 2013 passage of the LCFF, not only gives California a chance to address historical inequities, but provides the CDE an opportunity to address and update the way we engage and work with one another to better support California's schools and the students they serve.
Performance on these multiple measures will be reported through the new California School Dashboard (Dashboard), coming March 2017. The new accountability system reflects a clear expectation that all LEAs and schools can and should improve and emphasizes equity by focusing on student group performance. This new multiple measures system replaces the former Academic Performance Index (API), which was based solely on testing results, and the federal requirement to calculate Adequate Yearly Progress (AYP).
LEA and school performance in the ten LCFF priority areas are measured using a combination of state and local indicators.
State Indicators in the New State and Federal Accountability System
The criteria established for state indicators include: (1) being valid and reliable measures, (2) having comparable, state-level data, and (3) the ability to disaggregate data by student groups. These criteria ensure a common and comparable way of measuring performance on the indicators across the state.
The state indicators apply to all LEAs, schools, student groups (e.g., race/ethnicity, socioeconomically disadvantaged, ELs, and students with disabilities [SWD]), and progress on the indicators is reported through the Dashboard.
Local Indicators in the New State and Federal Accountability System
There are several LCFF priority areas that do not meet the criteria established for the state indicators. These remaining priority areas are considered local indicators and will require LEAs to determine whether they have Met, Not Met, or Not Met for Two or More Years for each applicable local indicator. The local indicators only apply at the LEA level. LEAs will use the local indicators to evaluate and report their progress on priority areas. The local indicators will only appear on the LEA Dashboard.
Table 1 lists each priority area and its corresponding state and/or local indicator.
Table 1: The State and Local Indicators for Each Local Control Funding Formula Priority Area
Local Control Funding Formula Priority Area
|
State Indicators
|
Local Indicators
|
|---|---|---|
| Basic Services and Conditions at schools (Priority 1) | N/A | Access to textbook, adequate facilities, and appropriately assigned teachers |
| Implementation of State Academic Standards (Priority 2) | N/A | Annual report on progress in implementing the standards for all content areas |
Parent Engagement (Priority 3)
| N/A | Annual report on progress toward: (1) seeking input from parents/guardians in decision making; and (2) promoting parental participation in programs |
| Student Achievement (Priority 4) | Academic Indicator | N/A |
| Student Achievement (Priority 4) | English Learner Progress Indicator | N/A |
| Student Engagement (Priority 5) | Graduation Rate Indicator | N/A |
| Student Engagement (Priority 5) | Chronic Absenteeism Indicator (not available until Fall 2018) | N/A |
| School Climate (Priority 6) | Suspension Rate Indicator | Administer a Local Climate Survey every other year |
| Access to a Broad Course of Study (Priority 7) | N/A | College/Career Indicator (Status Only) for the initial release |
| Outcomes in a Broad Course of Study (Priority 8) | N/A | College/Career Indicator (Status Only) for the initial release |
Table 2: The Following Indicators are for County Offices of Education (COEs) Only
| Local Control Funding Formula Priority Area | State Indicators | Local Indicators |
|---|---|---|
| Coordination of Services for Expelled Students (Priority 9) | N/A | Annual survey that measures progress in coordinating instruction for expelled students |
Coordination of Services for Foster Youth (Priority 10)
| N/A | Annual survey that measures progress in coordinating services for foster youth |
The California Way
California's integrated accountability system meets both state and federal requirements. The multiple measures system for state indicators is based on percentiles to create a five-by-five grid that produces 25 results and 5 performance levels (Blue, Green, Yellow, Orange, and Red). This five-by-five grid combines Status and Change to make an overall determination for each indicator and provides equal weight to both Status and Change.
Status is based on the most recent year of data for that indicator. The five Status levels are:
- Very high
- High
- Medium
- Low
- Very low
Change is the difference between performance from the most recent year of data and the prior year data. The five Change levels are:
- Increased significantly
- Increased
- Maintained
- Declined
- Declined significantly
The performance levels (i.e., the cut scores for Status and Change) serve as the performance standards for the state indicators. The California State Board of Education (SBE) approved separate performance standards for each state indicator based on the current distribution of statewide performance for Status and Change (much like grading on a curve). Therefore, the performance standards are different for each indicator. The performance standards will generally remain fixed for several years.
Combining Status and Change results in a color-coded performance level for each state indicator for LEAs, schools, and student groups with 30 or more students. The five color-coded performance levels in order are: blue (highest), green, yellow, orange, and red (lowest). The circles on the left-hand side of the chart are used in the Dashboard to graphically display the performance levels for LEAs, schools, and student groups. Each circle has a different number of segments that corresponds to a specific color. For example, the red performance level has one colored segment and the blue performance level has five colored segments. Having different numbers of colored segments allows the viewer to distinguish the performance levels, or colors, if the report is printed in black and white. Continue Reading: California Accountability Model & School Dashboard - Accountability (CA Dept of Education) - http://www.cde.ca.gov/ta/ac/cm/index.asp