Latest News and Comment from Education

Wednesday, March 15, 2017

State releases second report potentially more useful than its new dashboard | EdSource

State releases second report potentially more useful than its new dashboard | EdSource:

State releases second report potentially more useful than its new dashboard

This is a section of the Five-by-Five Placement grid showing how San Jose Unified's schools did on the Smarter Balanced English language arts test for grades 3 to 8. The horizontal axis measures performance over time. The vertical axis measures results on the latest test. A school's color is the intersection of the two.


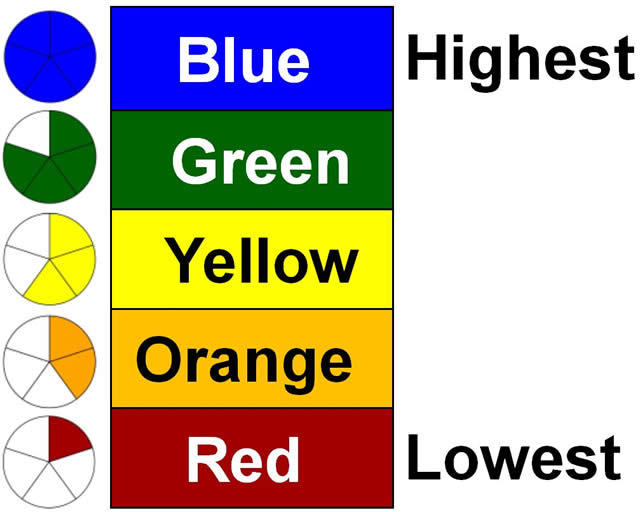
Separate from its new California School Dashboard, the California Department of Education has prepared another online resource that some school officials say may be more useful than the dashboard itself. It consists of color grids showing a breakdown of how every school in a district did on each performance indicator, with links to each school’s dashboard report.
The California Model Five-by-Five Placement Reports & Data, as the site is called, is a one-stop school comparison tool that will enable parents, teachers and district administrators to identify high-performing schools that could serve as models and low-performing schools as priorities for help in a district’s Local Control and Accountability Plan, or LCAP.
“The Five-by-Five reports are where most people will gravitate to for the most useful information,” said Sanger Unified Superintendent Matt Navo.
School districts’ overall performance could mask low-performing schools and student subgroups that the Five-by-Five reports would show. San Jose Unified, for example, scored in the top half of districts statewide in all five indicators on the state’s dashboard. It earned green ratings for its suspension and graduation rates, as well as for its English language arts and math test scores. It earned a yellow rating for English learner progress.
But the district’s Five-by Five reports revealed disparities among schools and subgroups. Pacific Islanders were ranked red on the math test and orange on the English test, while students with disabilities ranked red on the English test and orange on the math test, as well as in suspension and graduation rates. English learners ranked orange on suspension rates.
Six out of 39 district schools were rated orange in suspension rates, including five elementary schools and San Jose High School. That high school also earned an orange for its graduation rate of 83.7 percent and was among seven schools in the district rated red for English learner progress. Seven more district schools were State releases second report potentially more useful than its new dashboard | EdSource:


Jeff Bryant: What Betsy DeVos Means When She Says ‘Public Schools’

What Betsy DeVos Means When She Says ‘Public Schools’:

What Betsy DeVos Means When She Says ‘Public Schools’


Betsy DeVos once called public schools a “dead end,” but now that she’s U.S. Secretary of Education, she’s suddenly all for them.
At least that’s what she claims now.
During her nomination process, numerous reporters noted DeVos’s obvious bias against public schools. As education journalist Valerie Strauss reported on her blog at the Washington Post, DeVos “made some controversial statements” about public schools, “calling the traditional public education system a ‘dead end.’” Strauss noted DeVos had once said, “government truly sucks.”
But now she claims to be all for public schools, at least according to reports on her recent speech to a conference of big city school leaders. “I’ve said this before, and it bears repeating,” Education Week reports, “I support great public schools.”
Has DeVos had a sudden change of heart? That’s doubtful.
First, recall her first visit to a public school shortly after taking office. After her brief tour of Jefferson Middle School Academy in Washington, DC, DeVos castigated teachers for being in “receive mode … waiting to be told what they have to do.”
So what does her claim of a new-found fondness for “great public schools” really mean?
What Does Devos Mean By ‘Great Public School?’
First set aside the squishy modifier “great.”
There is widespread disagreement on what a “great” school is and how you can tell a school deserves that modifier.
Many states that were coerced into imposing school rating systems to supposedly determine, in an objective way, the quality of schools are in the process of dumping those rating systems. Recently, Michigan, DeVos’s home state, got rid of its rating system.
So what does DeVos mean by “public school?”
It turns out that’s becoming a squishy term too, at least if school choice advocates have their way.
Are Private Schools Public?
As NC Policy Watch, a left-leaning group in North Carolina, reports, the Tar Heel state has been targeted by school choice pressure groups to re-define what it means to be a public school.
The effort, according to education reporter Billy Ball, is “geared toward rebranding for-profit virtual charters and private school recipients of What Betsy DeVos Means When She Says ‘Public Schools’:


Coal, Oil Industry Woes Lead to Education Budget Cuts - The Atlantic

Coal, Oil Industry Woes Lead to Education Budget Cuts - The Atlantic:

Why Oil and Coal States Are Slashing Their Education Budgets
Wyoming is the latest state to cut spending for K-12 schools


Wyoming Governor Matt Mead signed legislation on Monday approving $34.5 million in cuts to the state’s K-12 education budget. The new spending plan also denies tax increases that would raise additional money for education, though it does establish a special committee to determine future modes of funding. Ultimately, the legislation seeks to address a shortfall in Wyoming’s education budget that could reach $1.8 billion by 2022.

“We’re going to need to think about funding education as a Chevy rather than a Cadillac in the future,” Jillian Balow, the state superintendent of public instruction, told The Casper Star-Tribune back in December.

Beyond overspending, there’s a larger explanation for why these budget cuts are necessary. The majority of Wyoming’s funding for public education comes from taxes and other revenue sources that depend on the state’s declining oil and coal industries.
In 2016, the U.S. Department of Energy reported that coal production had reached its lowest point in 35 years, forcing many coal companies to declare bankruptcy. Oil prices in the U.S. have also fallen from $99 a barrel in 2014 to $30 a barrel in January 2016.

As these industries struggle, states that depend on them like Wyoming, Alaska, and Oklahoma are forced to cut spending for education. According to data from 2011-2012, around 30 percent of Wyoming’s education spending comes from federal mineral royalties, while another 30 percent comes from property taxes often backed by these minerals.

2016 report from the Rockefeller Institute of Government identifies eight Coal, Oil Industry Woes Lead to Education Budget Cuts - The Atlantic:


Digitally Damning a Student’s Future with Old Data

Digitally Damning a Student’s Future with Old Data:

Digitally Damning a Student’s Future with Old Data

You build on failure. You use it as a stepping stone. Close the door on the past. You don’t try to forget the mistakes, but you don’t dwell on it. You don’t let it have any of your energy, or any of your time, or any of your space.
—Johnny Cash
Some colleges and universities are now collecting sophisticated data about a student’s past performance and using it for what is called “predictive analysis” which has the potential to stigmatize students and sort them into categories of success or failure.
While this is only happening in a few colleges and universities, my guess is that it’s a matter of time before we see such a program used in the K-12 setting.
Predictive analysis includes past data collected on the student that they might not even know about! It combines all this information together into a report.
The claim is that such information assists in pinpointing problems and steering students in the right direction—to determine if they can do well in college. The catch is that this will only happen if adults with a good background and preparation in understanding this information are there to assist students.
Without the personal human element, such information will only unfairly sort and stigmatize individuals. Students will be labeled failures by a digital program devised by those outside of the child’s life who don’t know the student!
Most teachers like to give new students a clean slate when they enter the classroom. Even if a student has had behavioral or learning difficulties in the past, we still like to Digitally Damning a Student’s Future with Old Data:

School Choice Meltdown in Motown – Have You Heard

School Choice Meltdown in Motown – Have You Heard:

School Choice Meltdown in Motown

I talked to parents in Detroit who are living through that city’s experiment in unregulated school choice…
Since Betsy DeVos was nominated to serve as the top edu-official in the land, her role in shaping Detroit as an education laboratory in which an out-of-control lab fire now burns, has been subject to plenty of scrutiny. But we haven’t heard enough from parents who are living through the city’s experiment in unregulated school choice. In this episode of Have You Heard, the final installment of my ten-part series with collaborator Aaron French, I headed to Detroit to talk to parents about Motown’s school choice meltdown. They describe what it’s like when schools shut down without notice, leaving them to fend for themselves in the “education marketplace,” while mass school closures have left whole neighborhoods without schools. It’s a hard story to hear, and yet these parents, and the advocacy group they’re part of, 482Forward, will leave you feeling hopeful—something we could all use a little more of these days!


Jennifer Berkshire:One thing you need to know about Detroit — it’s enormous, covering some 140 square miles. It’s also seen more school closures than any other city. Nearly 200 schools closed here between 2000 and 2015. For parents and neighborhoods that have borne the brunt of these closings, that can mean lengthy trips just to get their kids to school.

Dawn Wilson-Clark:Two years ago I was driving 200 miles a week to four different schools trying to ensure that my children had a really good education. Now I’m down to 160, but I’m paying a tuition.

Berkshire:That’s Dawn Wilson-Clark. She’s got a big family, seven kids, and all that time she spends driving them around reflects the reality of Detroit’s education marketplace. Schools here aren’t evenly spread across the city. In the Brightmoor neighborhood where Clark has lived for the past 18 years, there are hardly any schools left.

Wilson-Clark:When I moved there, we had nine Detroit public schools. Now it’s only one.

Berkshire:You’ve probably heard of a food desert. Well, whole sections of Detroit are now school deserts. Even as new schools have opened up here, they’re not necessarily located in parts of the city that have the most kids. Brightmoor has 3,500 students but just one school that goes all the way up to 12th School Choice Meltdown in Motown – Have You Heard:

It’s not just public schools that are being defunded to death. | Reclaim Reform

It’s not just public schools that are being defunded to death. | Reclaim Reform:

It’s not just public schools that are being defunded to death

It’s not just public schools that are being defunded to death. Betsy DeVos is the tip of merely one crumbling iceberg. Dismantling America’s essential social services is highly profitable for an oligarchy of corporate billionaires and their political cronies. Shock and Awe methods assure that multiple targets are hit fast and hard to keep people divided, to avoid mass resistance for a single cause. Ask Naomi Klein how this works.
For 24 million American men, women and children, a death panel looks like President Trump and Speaker of the House Paul Ryan – with the smiling approval of the majority of Congress. “Healthcare” that condemns 24 million Americans to slow and painful It’s not just public schools that are being defunded to death. | Reclaim Reform:


SCTA Bargaining for the Common Good - Sacramento City Teachers Association

Bargaining for the Common Good - YouTube:

SCTA Bargaining for the Common Good 


The Sacramento City Teachers Association included parents, business leaders and community members in their contract negotiations in their bid to make Sac City the destination district in California for students and educators. 

Always Be Testing – The Sales Pitch for Corporate Education Reform | gadflyonthewallblog

Always Be Testing – The Sales Pitch for Corporate Education Reform | gadflyonthewallblog:

Always Be Testing – The Sales Pitch for Corporate Education Reform

Screen Shot 2017-03-15 at 10.31.13 AM
(After the “Brass Balls” speech in “Glengarry Glen Ross,” by David Mamet.)
(Rated PG-13 for language)
(Interior: a public school classroom during an after school staff meeting. Teachers are seated at student desks including Singer, Moss and Aaronow. Williamson, a middle school principal, stands in front of the room flanked by Blake, a motivational speaker brought in by the state. Singer is furiously grading papers. The other teachers are pleasantly chatting about trifles before Blake calls the gathering to attention.)
[Blake]

Let me have your attention for a moment! So you’re talking about what? You’re talking about that kid you failed, some son of a bitch who doesn’t want to pass, some snot-nosed brat you’re trying to remediate and so forth. Let’s talk about something important. Are they all here?
[Williamson]

All but one.
[Blake]

Well, I’m going anyway. Let’s talk about something important! (to Singer) Put that colored marker down!
[Singer]
But I’m grading papers…
(Blake)
I said Put that marker down! Markers are for testers only.
(Singer scoffs)
[Blake]
Do you think I’m fucking with you? I am not fucking with you. I’m here from downtown. I’m here from the Governor and the Legislature. And I’m here on Always Be Testing – The Sales Pitch for Corporate Education Reform | gadflyonthewallblog:

The Suspension Conundrum: Do Suspensions Improve Behavior and Academic Outcomes for All Students or, a Pipeline to Dropping Out and Prison? | Ed In The Apple

The Suspension Conundrum: Do Suspensions Improve Behavior and Academic Outcomes for All Students or, a Pipeline to Dropping Out and Prison? | Ed In The Apple:

The Suspension Conundrum: Do Suspensions Improve Behavior and Academic Outcomes for All Students or, a Pipeline to Dropping Out and Prison?

Image result for The Suspension Conundrum: Do Suspensions Improve Behavior and Academic Outcomes for All Students or, a Pipeline to Dropping Out and Prison?


A few weeks after the election of de Blasio in 2013 I dropped by the transition tent to listen to a panel of community activists talk education. The panel trashed the Department of Education over excessive numbers of student suspensions, for the panelists, evidence that the “school to prison pipeline” was alive and well.
(Read herehere  and here).
The data is clear, students who are suspended in the 4th grade are likely not to graduate high school and the more frequent the suspensions the more likely the student will enter the criminal justice system.
As a reaction school districts have sharply curtailed the numbers of suspensions, especially in urban school systems.
Twenty-seven states have revised their laws to reduce the use of exclusionary discipline, and more than 50 of America’s largest school districts, serving more than 6.35 million students, have implemented discipline reforms. From 2011–12 to 2013–14, the number of suspensions nationwide fell by nearly 20%.
Is there a downside to reducing suspensions?
Advocates of discipline reform claim that a suspension may have negative effects on the student being disciplined. Critics are concerned that lax discipline may lead to more disruptive behavior, disrupting classrooms and harming students who want to learn.
A just-released report from the Manhattan Institute (“School Discipline Reform and Disorder: Evidence from New York City Public School, 2012 – 2016 “) takes a deep dive into the suspension and school climate data.

CURMUDGUCATION: Littles-- More Than a Score (A Film You Should See)

CURMUDGUCATION: Littles-- More Than a Score (A Film You Should See):

Littles-- More Than a Score (A Film You Should See)

Image result for More … than a score

Of all the issues swirling around education, this is the one that keeps me up nights.
What about the littles?
There are plenty of terrible things happening in the world of education, but nothing is more heartbreaking than the transformation of kindergarten into first grade, the sudden "need" for four year olds to start learning letters and numbers and colors because now these children "need" to get ready for kindergarten. The sitting. The studying. The homework. The standardized testing for small children who should be playing and socializing and learning about the wonder and joy of being in the world. It all seems designed to crush the most vulnerable spirits we are entrusted with.
Marie Amoruso has been a teacher, an author and adjunct professor at Teachers College Columbia University, and Manhattanville College. She runs a consulting agency, and she has created a short film about this very subject. Yes, "More Than a Test Score" is not exactly a groundbreaking title, and yes, her delivery is at times a little over-fraught and yes, she kind of muddies Common Core in with other issues. But when she turns her camera on the classrooms of young children, she cuts right to the heart of what is so deeply wrong with the test-centered school movement. In seventeen minutes, with the help of several interview subjects, she addresses what children need and what they aren't getting, and she takes us right into the classrooms to see the effects.


Teachers know what to do-- the issue, as she lays it out, is getting the freedom to let them do it. In the absence of that, students learn to hate school. 
I'm not sure how we can save the public school system if this is the way it starts. And my concerns are not just professional, but also personal-- I have twin sons on the way in just a few months, which means that we've got about four or five years to figure out whether or not the local pubic school can be trusted to treat my children well.CURMUDGUCATION: Littles-- More Than a Score (A Film You Should See):

Jersey Jazzman: NJ Charter Schools - A Fool's Gold Rush: Vineland

Jersey Jazzman: NJ Charter Schools - A Fool's Gold Rush: Vineland:

NJ Charter Schools - A Fool's Gold Rush: Vineland

Image result for NJ Charter Schools - A Fool's Gold Rush:

Here are all the parts of this series so far:

Prelude

Franklin, NJ

Princeton, NJ

Vineland, NJ

Here in New Jersey, the state's school funding formula has become a topic of intense debate. Now that Chris Christie has abandoned his "Fairness Formula" -- a ridiculously unfair and inefficient proposal -- attention has turned to Senate President Steve Sweeney's school funding proposal:


HAMMONTON — Senate President Stephen Sweeney said Friday he wants revisions to the school-funding formula in place for the 2017-18 school year.
“Every year, the gap gets greater,” he said during a visit to the Hammonton School District to discuss school funding. “Every year there is flat funding we are losing ground.”
[...]
Sweeney said he recognizes some districts would lose funding under a revised plan, but those districts have known for years they are getting more state aid than they should, and they should have been making plans. [emphasis mine]
Sweeney's plan is to create a commission to recommend changes to the state's funding formula, SFRA. I don't necessarily have a problem with asking some districts with relatively high property values to pay more in local taxes, but the devil's in the details, and those details are scarce. I'll save a larger discussion of school funding for another day; right now, I want to focus on this:

Helen Haley, the business administrator for the Vineland School District, said they would lose money under the proposed revisions, and it would be devastating for the district, which is among the poorest in the state.
“We have cut 57 positions through attrition,” she said. “We are a large rural area, so transportation costs are high. Our special-education population is growing. But we have trouble raising taxes because of economic conditions.”
Sweeney said special education is an area that must be addressed, and the district could get additional aid there to make up for losses in other aid.
According to data from the Education Law Center, Vineland's local fair share of taxes is relatively low. Whether the town should pay more is an open question, particularly because, as Jeff Bennett notes, many districts paying low school taxes actually have high municipal taxes. Is Vineland in that group? I can't say at this time...

But I do know this: Vineland, like all other New Jersey school districts, should be seeking to 
Jersey Jazzman: NJ Charter Schools - A Fool's Gold Rush: Vineland:


California’s long-awaited School Dashboard debuts | EdSource + CA Dept of Education

California’s long-awaited School Dashboard debuts | EdSource:

California's long-awaited School Dashboard debuts

A picture of the five performance levels in the California School Dashboard. There are five circles on the left side. Each circle has five segments. From top to bottom, the first circle has all five segments that are colored blue. The second circle has four of the five segments that are colored green. The third circle has three of the five segments that are colored yellow. The fourth circle has two of the five segments that are colored orange. The fifth circle has one of the five segments that are colored red.There are five rectangles in the middle. From top to bottom, the first rectangle is blue and corresponds to the circle with all five segments colored blue. The second row is green and corresponds to the circle with four of the five segments colored green. The third row is yellow and corresponds to the circle with three of the five segments colored yellow. The fourth row is orange and corresponds to the circle with two of the five segments colored orange. The fifth row is red and corresponds to the circle with one of the five segments colored red. On the right side, the text at the top and reads


The California School Dashboard, a website with multicolor displays rating schools and districts on a range of performance measurements, went live today.
Years in planning, the website broadens the concept of a successful school from a single metric – standardized test scores – to multiple indicators measuring academic achievement, school climate, student engagement and other priorities specified in the Local Control Funding Formula. The State Board of Education said the website is intended to provide data for school improvement as well as information for parents and the public.

To emphasize the priority of addressing achievement gaps, the dashboard’s home page, called the Equity Report, highlights a school’s or district’s low-performing students from among a dozen subgroups that include low-income students, English learners, students with disabilities and other racial and ethnic groups. Performance levels are shown as one of five colors, from red, signifying the lowest performance, to blue, the highest level of achievement. Orange, yellow and green are in between (see note below**).
The dashboard doesn’t provide statewide averages for any indicator or an overall ranking of a school or district. That was the deliberate decision of the state board and a departure from the previous Academic Performance Index or API, which assigned a number between California’s long-awaited School Dashboard debuts | EdSource:

California Accountability Model & School Dashboard


Image result for California Accountability Model & School Dashboard

Reports

California School Dashboard Report External link opens in new window or tab. 
The Dashboard contains reports that display the performance of local educational agencies (LEAs), schools, and student groups on a set of state and local measures to assist in identifying strengths, weaknesses, and areas in need of improvement.
California Model Five-by-Five Grid Placement Reports
California's new accountability and continuous improvement system is based on a five-by-five colored table that produces 25 results using five colors. The reports display the schools' (by district) and student groups' placement on the five-by-five colored tables.

Overview

California School Dashboard Video External link opens in new window or tab. (Video; 5:25)
This video provides an overview of California's new multiple measures accountability system. It describes the measures in the new Dashboard Report and how performance and improvement are used to determine the performance colors.

Background

Based on the Local Control Funding Formula (LCFF), which was passed in 2013, California has a new accountability system that is based on multiple measures. These measures are used to determine local educational agency (LEA) and school progress toward meeting the needs of their students. The measures are based on factors that contribute to a quality education, including high school graduation rates, college/career readiness, student test scores, English learner (EL) progress, suspension rates, and parent engagement.
The sweeping overhaul of California's Accountability and Continuous Improvement System, ushered in with the 2013 passage of the LCFF, not only gives California a chance to address historical inequities, but provides the CDE an opportunity to address and update the way we engage and work with one another to better support California's schools and the students they serve.
Performance on these multiple measures will be reported through the new California School Dashboard External link opens in new window or tab. (Dashboard), coming March 2017. The new accountability system reflects a clear expectation that all LEAs and schools can and should improve and emphasizes equity by focusing on student group performance. This new multiple measures system replaces the former Academic Performance Index (API), which was based solely on testing results, and the federal requirement to calculate Adequate Yearly Progress (AYP).
LEA and school performance in the ten LCFF priority areas are measured using a combination of state and local indicators.

State Indicators in the New State and Federal Accountability System

The criteria established for state indicators include: (1) being valid and reliable measures, (2) having comparable, state-level data, and (3) the ability to disaggregate data by student groups. These criteria ensure a common and comparable way of measuring performance on the indicators across the state.
The state indicators apply to all LEAs, schools, student groups (e.g., race/ethnicity, socioeconomically disadvantaged, ELs, and students with disabilities [SWD]), and progress on the indicators is reported through the Dashboard.

Local Indicators in the New State and Federal Accountability System

There are several LCFF priority areas that do not meet the criteria established for the state indicators. These remaining priority areas are considered local indicators and will require LEAs to determine whether they have Met, Not Met, or Not Met for Two or More Years for each applicable local indicator. The local indicators only apply at the LEA level. LEAs will use the local indicators to evaluate and report their progress on priority areas. The local indicators will only appear on the LEA Dashboard.
Table 1 lists each priority area and its corresponding state and/or local indicator.
Table 1: The State and Local Indicators for Each Local Control Funding Formula Priority Area
Local Control Funding Formula Priority Area
State Indicators
Local Indicators
Basic Services and Conditions at schools (Priority 1)N/AAccess to textbook, adequate facilities, and appropriately assigned teachers
Implementation of State Academic Standards (Priority 2)N/AAnnual report on progress in implementing the standards for all content areas
Parent  Engagement (Priority 3)
N/AAnnual report on progress toward: (1) seeking input from parents/guardians in decision making; and (2) promoting parental participation in programs
Student Achievement (Priority 4)Academic IndicatorN/A
Student Achievement (Priority 4)English Learner Progress IndicatorN/A
Student Engagement (Priority 5)Graduation Rate IndicatorN/A
Student Engagement (Priority 5)Chronic Absenteeism Indicator (not available until Fall 2018)N/A
School Climate (Priority 6)Suspension Rate IndicatorAdminister a Local Climate Survey every other year
Access to a Broad Course of Study (Priority 7)N/ACollege/Career Indicator (Status Only) for the initial release
Outcomes in a Broad Course of Study (Priority 8)N/ACollege/Career Indicator (Status Only) for the initial release


Table 2: The Following Indicators are for County Offices of Education (COEs) Only
Local Control Funding Formula Priority AreaState IndicatorsLocal Indicators
Coordination of Services for Expelled Students (Priority 9)N/AAnnual survey that measures progress in coordinating instruction for expelled students
Coordination of Services for Foster Youth (Priority 10)
N/AAnnual survey that measures progress in coordinating services for foster youth


The California Way

California's integrated accountability system meets both state and federal requirements. The multiple measures system for state indicators is based on percentiles to create a five-by-five grid that produces 25 results and 5 performance levels (Blue, Green, Yellow, Orange, and Red). This five-by-five grid combines Status and Change to make an overall determination for each indicator and provides equal weight to both Status and Change.
Status is based on the most recent year of data for that indicator. The five Status levels are:
  • Very high
  • High
  • Medium
  • Low
  • Very low
Change is the difference between performance from the most recent year of data and the prior year data. The five Change levels are:
  • Increased significantly
  • Increased
  • Maintained
  • Declined
  • Declined significantly
The performance levels (i.e., the cut scores for Status and Change) serve as the performance standards for the state indicators. The California State Board of Education (SBE) approved separate performance standards for each state indicator based on the current distribution of statewide performance for Status and Change (much like grading on a curve). Therefore, the performance standards are different for each indicator. The performance standards will generally remain fixed for several years.
Combining Status and Change results in a color-coded performance level for each state indicator for LEAs, schools, and student groups with 30 or more students. The five color-coded performance levels in order are: blue (highest), green, yellow, orange, and red (lowest). The circles on the left-hand side of the chart are used in the Dashboard to graphically display the performance levels for LEAs, schools, and student groups. Each circle has a different number of segments that corresponds to a specific color. For example, the red performance level has one colored segment and the blue performance level has five colored segments. Having different numbers of colored segments allows the viewer to distinguish the performance levels, or colors, if the report is printed in black and white. Continue Reading: California Accountability Model & School Dashboard - Accountability (CA Dept of Education) - http://www.cde.ca.gov/ta/ac/cm/index.asp