
On “Dropout Factories” & (Fraudulant) Graduation Rates in NJ
Posted on April 29, 2014
0
This NJ Star Ledger piece the other day reminded me of an issue I’ve been wanting to check out for some time now. I’m skeptical of graduation rates as a measure of student outcomes to begin with, because, of course, graduation can be strongly influenced by local norms and practices. As such, it’s really hard to validly compare graduation rates from one place to another or even over time, as graduation standards may change. Notably, arbitrary assignment of “passing” cut scores on high stakes assessment isn’t particularly helpful and can be quite harmful. But I digress.
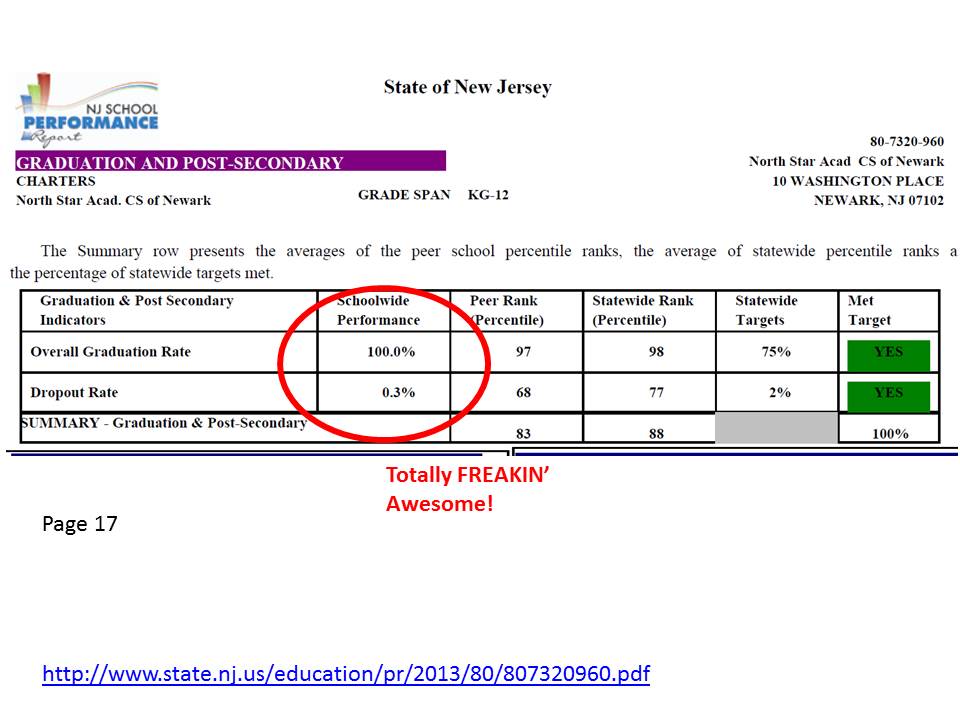
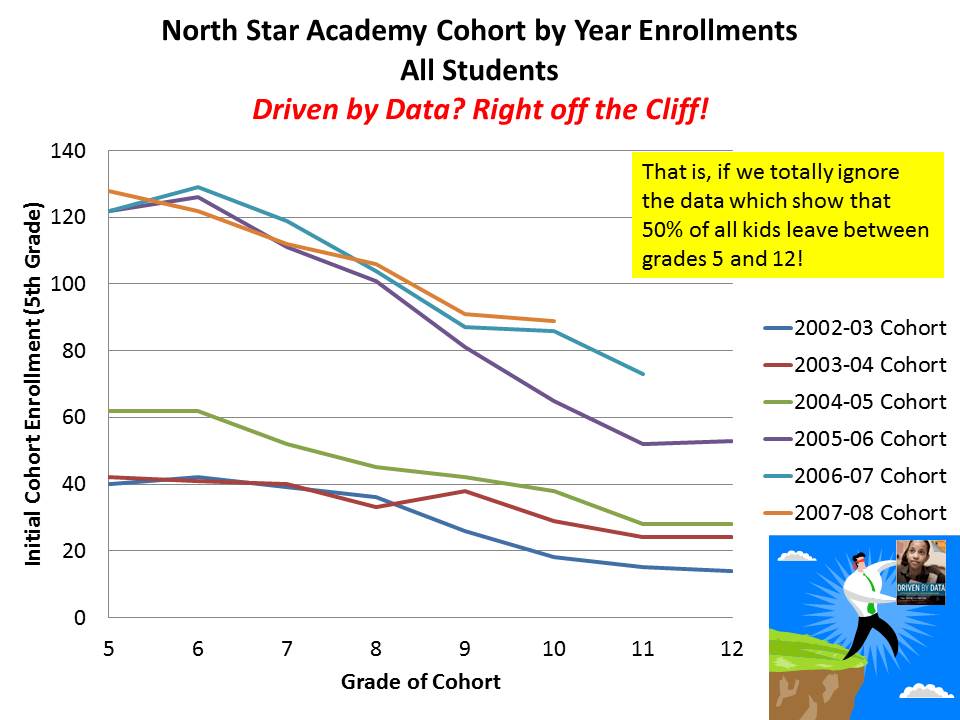
What piqued my interest a while back was the apparent disconnect between cohort attrition measures from 9th to 12th grade, or 10th to 12th grade, and reported graduation rates. Indeed, these are two different things. BUT, it seems strange for example that North Star Academy in Newark could report a 100% graduation rate! and .3% dropout rate! while having approximately50% attrition rate between grades 5 and 12! How can you lose half your kids over time and still have 100% graduation and effectively no dropouts. Of course the answer is that none of these are dropouts, but rather they are voluntary transfers (with no follow up to determine where they’ve gone or what happened to them).
In any case, it seemed at best, a bit disingenuous and at worst, outright fraudulent for North Star to present itself as near perfect, when a deeper dive into the data (something North Star’s own data driven leaders fail to ever report) suggest otherwise.
Here, I quickly explore the significance of this issue across charter and district schools statewide.
First, let’s look at 2013 graduation rates and the 2012-13 fall enrollment cohorts as seniors relative to themselves as freshman.
 As the key indicates, orange dots are district cohort ratios – representing the senior class of 2013 as a percent of who they were as a freshman class of 2009-10. Green dots are graduation rates for all of the same district schools. Blue circles are reported graduation rates for charters and red On “Dropout Factories” & (Fraudulant) Graduation Rates in NJ | School Finance 101: