Latest News and Comment from Education

Wednesday, March 15, 2017

Jersey Jazzman: NJ Charter Schools - A Fool's Gold Rush: Vineland

Jersey Jazzman: NJ Charter Schools - A Fool's Gold Rush: Vineland:

NJ Charter Schools - A Fool's Gold Rush: Vineland

Image result for NJ Charter Schools - A Fool's Gold Rush:

Here are all the parts of this series so far:

Prelude

Franklin, NJ

Princeton, NJ

Vineland, NJ

Here in New Jersey, the state's school funding formula has become a topic of intense debate. Now that Chris Christie has abandoned his "Fairness Formula" -- a ridiculously unfair and inefficient proposal -- attention has turned to Senate President Steve Sweeney's school funding proposal:


HAMMONTON — Senate President Stephen Sweeney said Friday he wants revisions to the school-funding formula in place for the 2017-18 school year.
“Every year, the gap gets greater,” he said during a visit to the Hammonton School District to discuss school funding. “Every year there is flat funding we are losing ground.”
[...]
Sweeney said he recognizes some districts would lose funding under a revised plan, but those districts have known for years they are getting more state aid than they should, and they should have been making plans. [emphasis mine]
Sweeney's plan is to create a commission to recommend changes to the state's funding formula, SFRA. I don't necessarily have a problem with asking some districts with relatively high property values to pay more in local taxes, but the devil's in the details, and those details are scarce. I'll save a larger discussion of school funding for another day; right now, I want to focus on this:

Helen Haley, the business administrator for the Vineland School District, said they would lose money under the proposed revisions, and it would be devastating for the district, which is among the poorest in the state.
“We have cut 57 positions through attrition,” she said. “We are a large rural area, so transportation costs are high. Our special-education population is growing. But we have trouble raising taxes because of economic conditions.”
Sweeney said special education is an area that must be addressed, and the district could get additional aid there to make up for losses in other aid.
According to data from the Education Law Center, Vineland's local fair share of taxes is relatively low. Whether the town should pay more is an open question, particularly because, as Jeff Bennett notes, many districts paying low school taxes actually have high municipal taxes. Is Vineland in that group? I can't say at this time...

But I do know this: Vineland, like all other New Jersey school districts, should be seeking to 
Jersey Jazzman: NJ Charter Schools - A Fool's Gold Rush: Vineland:


California’s long-awaited School Dashboard debuts | EdSource + CA Dept of Education

California’s long-awaited School Dashboard debuts | EdSource:

California's long-awaited School Dashboard debuts

A picture of the five performance levels in the California School Dashboard. There are five circles on the left side. Each circle has five segments. From top to bottom, the first circle has all five segments that are colored blue. The second circle has four of the five segments that are colored green. The third circle has three of the five segments that are colored yellow. The fourth circle has two of the five segments that are colored orange. The fifth circle has one of the five segments that are colored red.There are five rectangles in the middle. From top to bottom, the first rectangle is blue and corresponds to the circle with all five segments colored blue. The second row is green and corresponds to the circle with four of the five segments colored green. The third row is yellow and corresponds to the circle with three of the five segments colored yellow. The fourth row is orange and corresponds to the circle with two of the five segments colored orange. The fifth row is red and corresponds to the circle with one of the five segments colored red. On the right side, the text at the top and reads


The California School Dashboard, a website with multicolor displays rating schools and districts on a range of performance measurements, went live today.
Years in planning, the website broadens the concept of a successful school from a single metric – standardized test scores – to multiple indicators measuring academic achievement, school climate, student engagement and other priorities specified in the Local Control Funding Formula. The State Board of Education said the website is intended to provide data for school improvement as well as information for parents and the public.

To emphasize the priority of addressing achievement gaps, the dashboard’s home page, called the Equity Report, highlights a school’s or district’s low-performing students from among a dozen subgroups that include low-income students, English learners, students with disabilities and other racial and ethnic groups. Performance levels are shown as one of five colors, from red, signifying the lowest performance, to blue, the highest level of achievement. Orange, yellow and green are in between (see note below**).
The dashboard doesn’t provide statewide averages for any indicator or an overall ranking of a school or district. That was the deliberate decision of the state board and a departure from the previous Academic Performance Index or API, which assigned a number between California’s long-awaited School Dashboard debuts | EdSource:

California Accountability Model & School Dashboard


Image result for California Accountability Model & School Dashboard

Reports

California School Dashboard Report External link opens in new window or tab. 
The Dashboard contains reports that display the performance of local educational agencies (LEAs), schools, and student groups on a set of state and local measures to assist in identifying strengths, weaknesses, and areas in need of improvement.
California Model Five-by-Five Grid Placement Reports
California's new accountability and continuous improvement system is based on a five-by-five colored table that produces 25 results using five colors. The reports display the schools' (by district) and student groups' placement on the five-by-five colored tables.

Overview

California School Dashboard Video External link opens in new window or tab. (Video; 5:25)
This video provides an overview of California's new multiple measures accountability system. It describes the measures in the new Dashboard Report and how performance and improvement are used to determine the performance colors.

Background

Based on the Local Control Funding Formula (LCFF), which was passed in 2013, California has a new accountability system that is based on multiple measures. These measures are used to determine local educational agency (LEA) and school progress toward meeting the needs of their students. The measures are based on factors that contribute to a quality education, including high school graduation rates, college/career readiness, student test scores, English learner (EL) progress, suspension rates, and parent engagement.
The sweeping overhaul of California's Accountability and Continuous Improvement System, ushered in with the 2013 passage of the LCFF, not only gives California a chance to address historical inequities, but provides the CDE an opportunity to address and update the way we engage and work with one another to better support California's schools and the students they serve.
Performance on these multiple measures will be reported through the new California School Dashboard External link opens in new window or tab. (Dashboard), coming March 2017. The new accountability system reflects a clear expectation that all LEAs and schools can and should improve and emphasizes equity by focusing on student group performance. This new multiple measures system replaces the former Academic Performance Index (API), which was based solely on testing results, and the federal requirement to calculate Adequate Yearly Progress (AYP).
LEA and school performance in the ten LCFF priority areas are measured using a combination of state and local indicators.

State Indicators in the New State and Federal Accountability System

The criteria established for state indicators include: (1) being valid and reliable measures, (2) having comparable, state-level data, and (3) the ability to disaggregate data by student groups. These criteria ensure a common and comparable way of measuring performance on the indicators across the state.
The state indicators apply to all LEAs, schools, student groups (e.g., race/ethnicity, socioeconomically disadvantaged, ELs, and students with disabilities [SWD]), and progress on the indicators is reported through the Dashboard.

Local Indicators in the New State and Federal Accountability System

There are several LCFF priority areas that do not meet the criteria established for the state indicators. These remaining priority areas are considered local indicators and will require LEAs to determine whether they have Met, Not Met, or Not Met for Two or More Years for each applicable local indicator. The local indicators only apply at the LEA level. LEAs will use the local indicators to evaluate and report their progress on priority areas. The local indicators will only appear on the LEA Dashboard.
Table 1 lists each priority area and its corresponding state and/or local indicator.
Table 1: The State and Local Indicators for Each Local Control Funding Formula Priority Area
Local Control Funding Formula Priority Area
State Indicators
Local Indicators
Basic Services and Conditions at schools (Priority 1)N/AAccess to textbook, adequate facilities, and appropriately assigned teachers
Implementation of State Academic Standards (Priority 2)N/AAnnual report on progress in implementing the standards for all content areas
Parent  Engagement (Priority 3)
N/AAnnual report on progress toward: (1) seeking input from parents/guardians in decision making; and (2) promoting parental participation in programs
Student Achievement (Priority 4)Academic IndicatorN/A
Student Achievement (Priority 4)English Learner Progress IndicatorN/A
Student Engagement (Priority 5)Graduation Rate IndicatorN/A
Student Engagement (Priority 5)Chronic Absenteeism Indicator (not available until Fall 2018)N/A
School Climate (Priority 6)Suspension Rate IndicatorAdminister a Local Climate Survey every other year
Access to a Broad Course of Study (Priority 7)N/ACollege/Career Indicator (Status Only) for the initial release
Outcomes in a Broad Course of Study (Priority 8)N/ACollege/Career Indicator (Status Only) for the initial release


Table 2: The Following Indicators are for County Offices of Education (COEs) Only
Local Control Funding Formula Priority AreaState IndicatorsLocal Indicators
Coordination of Services for Expelled Students (Priority 9)N/AAnnual survey that measures progress in coordinating instruction for expelled students
Coordination of Services for Foster Youth (Priority 10)
N/AAnnual survey that measures progress in coordinating services for foster youth


The California Way

California's integrated accountability system meets both state and federal requirements. The multiple measures system for state indicators is based on percentiles to create a five-by-five grid that produces 25 results and 5 performance levels (Blue, Green, Yellow, Orange, and Red). This five-by-five grid combines Status and Change to make an overall determination for each indicator and provides equal weight to both Status and Change.
Status is based on the most recent year of data for that indicator. The five Status levels are:
  • Very high
  • High
  • Medium
  • Low
  • Very low
Change is the difference between performance from the most recent year of data and the prior year data. The five Change levels are:
  • Increased significantly
  • Increased
  • Maintained
  • Declined
  • Declined significantly
The performance levels (i.e., the cut scores for Status and Change) serve as the performance standards for the state indicators. The California State Board of Education (SBE) approved separate performance standards for each state indicator based on the current distribution of statewide performance for Status and Change (much like grading on a curve). Therefore, the performance standards are different for each indicator. The performance standards will generally remain fixed for several years.
Combining Status and Change results in a color-coded performance level for each state indicator for LEAs, schools, and student groups with 30 or more students. The five color-coded performance levels in order are: blue (highest), green, yellow, orange, and red (lowest). The circles on the left-hand side of the chart are used in the Dashboard to graphically display the performance levels for LEAs, schools, and student groups. Each circle has a different number of segments that corresponds to a specific color. For example, the red performance level has one colored segment and the blue performance level has five colored segments. Having different numbers of colored segments allows the viewer to distinguish the performance levels, or colors, if the report is printed in black and white. Continue Reading: California Accountability Model & School Dashboard - Accountability (CA Dept of Education) - http://www.cde.ca.gov/ta/ac/cm/index.asp

Matt Damon's Mom:What educators know about teaching young children — but policymakers ignore - The Washington Post

What educators know about teaching young children — but policymakers ignore - The Washington Post:

What educators know about teaching young children — but policymakers ignore

Image result for matt damon mom broken pencils
Matt Damon’s mom, also known as Dr. Nancy Carlsson-Paige, is an early childhood scholar who knows what she’s talking about when it comes to education.  Yes, Matt–her son–is an awesome actor with a lot to say about education, but let’s face it, he’s just another celebrity with an opinion.  If you’re looking for expert analysis concerning public education policy then “Mom Knows Best.”  Especially Matt Damon’s mom! Photo from BustED Pencils: Fully Leaded Education Talk - http://bustedpencils.com/

A new survey of early childhood educators found that they are highly concerned about how corporate school reform mandates are hurting children, especially those from low-income families, and how their own voices have been ignored about what young kids really need to learn.
The survey (see below) was done by a nonprofit called Defending the Early Years, which commissions research about early childhood education and advocates for sane policies for young children. It includes responses from teachers in several states about how they are trying to deal with the disconnect between reform policies and what they know to be healthy for children. The responses include:
What’s the research? How can the same teaching benchmarks for every child be appropriate when you have children in the same kindergarten classroom who are 12 months apart, who have such different needs, who vary so enormously in the experiences they’ve had?
Here’s a piece on the survey and the problems it exposes, written by  Nancy Carlsson-Paige, an early childhood development expert who has been at the forefront of the debate on how best to educate — and not educate — the youngest students.
Carlsson-Paige is a professor emerita of education at Lesley University in Cambridge, Ma., where she taught teachers for more than 30 years and was a founder of the university’s Center for Peaceable Schools. She is also a founding member of a nonprofit called Defending the Early Years, which commissions research about early childhood education and advocates for sane policies for young children.
She is also the author of “Taking Back Childhood.” The mother of two artist sons, Matt and Kyle Damon, she is also the recipient of numerous awards, including the Legacy Award from the Robert F. Kennedy Children’s Action Corps for work over several decades on behalf of children and families.
By Nancy Carlsson-Paige
There may be uncertainty about what early childhood education will look like under the leadership of new Education Secretary Betsy DeVos, but early education professionals have great clarity about what matters most when it comes to the education of young children.
A recent survey of more than 1,000 of the nation’s educators of young children found that 80 percent of the respondents said that early childhood educators had not been included in the decision-making processes and policies that affect their work. This explains why in recent years policies affecting early childhood education have become disconnected from what is known about young children and how they learn.
Results of the survey, conducted by the Defending the Early Years, were just presented at the National Association for the Education of Young Children’s Public Policy Forum, and should be used to guide policies and programs in early childhood education from this point forward.
For years now, starting with former President George W. Bush’s No Child Left Behind law and continuing with former President Obama’s Race to the Top program, policy makers have What educators know about teaching young children — but policymakers ignore - The Washington Post:


Mass incarceration of African Americans affects the racial achievement gap — report - The Washington Post

Mass incarceration of African Americans affects the racial achievement gap — report - The Washington Post:

Mass incarceration of African Americans affects the racial achievement gap — report


Consider:
* By the age of 14, approximately 25 percent of African American children have experienced a parent — in most cases a father — being imprisoned for some period of time. On any given school day, approximately 10 percent of African American schoolchildren have a parent who is in jail or prison, more than four times the share in 1980.
* The comparable share for white children is 4 percent; an African American child is six times as likely as a white child to have or have had an incarcerated parent.
* A growing share of African Americans have been arrested for drug crimes, yet African Americans are no more likely than whites to sell or use drugs. Of imprisoned fathers of African American children, only one-third are in prison because of a violent crime.
* Research in criminal justice, health, sociology, epidemiology, and economics demonstrates that when parents are incarcerated, children do worse across cognitive and noncognitive outcome measures — and the incarceration is a key cause. For example, children of incarcerated parents are more likely to drop out of school; develop learning disabilities; misbehave in school; suffer from migraines, asthma, high cholesterol, depression, anxiety, post-traumatic stress disorder and homelessness.
Those are findings from a new report released by the nonprofit Economic Policy Institute that says the “evidence is overwhelming that the unjustified incarceration of African American fathers (and, increasingly, mothers as well) is an important cause of the lowered performance of their children” and of the racial achievement gap.
When parents are imprisoned, it is not only they who suffer, but also their offspring. The number of children affected has grown to the point that we can reasonably infer that our criminal justice system is making an important contribution to the racial achievement gap in both cognitive and noncognitive skills.
The report also says that educators should view criminal justice reform as a key part of school reform and join forces with reformers in the area of criminal justice.
Educators have paid too little heed to this criminal justice crisis. Criminal justice reform should be a policy priority for educators who are committed to improving the achievement of African American children. While reform of federal policy may seem implausible in a Trump administration, educators can seize opportunities for such advocacy at state and local levels because many more parents are incarcerated in state than in federal prisons. In 2014, over 700,000 prisoners nationwide were serving sentences of a year or longer for nonviolent 
Mass incarceration of African Americans affects the racial achievement gap — report - The Washington Post:
 

Here’s the full report:
on Scribd


If charter schools don’t want their teachers to unionize, they’ll have to pay them like they’re in a union | On Politics | Chicago Reader

If charter schools don’t want their teachers to unionize, they’ll have to pay them like they’re in a union | On Politics | Chicago Reader:

If charter schools don’t want their teachers to unionize, they’ll have to pay them like they’re in a union 
The salary gap with public school teachers is one factor pushing charter teachers to unionize.

Back in 2012, when Chicago Public Schools teachers went on strike, Juan Rangel, the CEO of the UNO Charter School Network, proudly told reporters his schools were open.
And they had plenty of vacancies, so parents pissed off at the striking Chicago Teachers Union should come on down and enroll their kids. A similar note was sounded by other charter operators—and the subtext was hard to miss.
Charter school teachers don't want a union, wouldn't join one if they could, and, as one prominent business leader put it, don't even need one.
"The good teachers know they'll do fine," Bruce Rauner said in a speechshortly after the strike. "It's the weak teachers. It's the lousy, ineffective, lazy teachers that—unfortunately, there are a number of those—they're the ones that the union is protecting."
Man, how things have changed.
Rauner—now our governor—is still singing his same antiunion song. But Rangel's long gone from UNO, having been ousted after a contracting scandal. And UNO's teaching force is now unionized.
In fact, teachers at 32 of the city's 125 charter campuses are unionized. Last week, the teachers at one of these charters, Aspira, came close to going on strike before settling for a two-year contract with annual raises of 3 and 3.5 percent.
And now, teachers at Noble schools have announced they're taking the first steps to forming a union at their 17 Chicago campuses.
There are several reasons why charter school teachers are talking unions—including the uncertainty brought on by Rauner's withholding state aid to Chicago's schools, charters included.
But I'd like to focus on one money issue nobody wants to talk about: teacher salaries. As in how charter school teachers make less than their unionized peers.


Mike Klonsky's SmallTalk Blog: Chicago and its public schools have become profit centers for privatizers

Mike Klonsky's SmallTalk Blog: Chicago and its public schools have become profit centers for privatizers:

Chicago and its public schools have become profit centers for privatizers

Under our last two mayors, the city of Chicago and Chicago public schools have become centers of privatization. All public space from parking spaces, to red-light cameras, to trash collection, to the highways and skyways have become fair game for the privatizers.

I don't think so. 

The move to privatize everything public, to erode all public space and public decision-making comes as a reaction to the real and sometimes manufactured financial and other crises which have shaken cities from New Orleans, Detroit and now Chicago.

The pains of privatization have taken their greatest toll on public education, turning schools into profit centers mired in corruption and waste and impacting everything from the way we teach to the way we test. Relationships between students and their teachers have been torn apart with the massive closing of neighborhood schools and replacing them with networks of privately-managed charters.

Things will only get worse with the election of privateer Donald Trump and the appointment "choice" fanatic Betsy DeVos and Secretary of Education.

The privatization of CPS has been a disaster. It has further expanded racial segregation. It has led to union busting and the degradation of teachers and school staff. Schools under the management of Aramark and SodexoMagic have been left filthy and disgusting. They are also charging CPS $80M to oversee custodial work instead of custodians reporting to school principals through their union at no cost.

Privatization has also meant massive corruption leading to the great SUPES scandal and the conviction of former CEO Barbara Byrd-Bennett who is on her way to prison.

The latest moves by autocratic Mayor Rahm Emanuel and his hand-picked schools chief 
Mike Klonsky's SmallTalk Blog: Chicago and its public schools have become profit centers for privatizers:

The Bases are Loaded: Joanna Klonsky, Brian Sleet, Bill Iacullo, Kevin Coval and Diane Ravitch. Coming up on Hitting Left with the Klonsky Brothers. | Fred Klonsky

Joanna Klonsky, Brian Sleet, Bill Iacullo, Kevin Coval and Diane Ravitch. Coming up on Hitting Left with the Klonsky Brothers. | Fred Klonsky:
Joanna Klonsky, Brian Sleet, Bill Iacullo, Kevin Coval and Diane Ravitch. Coming up on Hitting Left with the Klonsky Brothers.


Over the next two weeks Hitting Left with the Klonsky Brothers has a heavy line up.
Friday, March 17th our guests will be Chicago progressive political activists and strategists Joanna Klonsky and Brian Sleet along with Bill Iacullo, President of the International Union of Operating Engineers Local 143-143b and Chief Engineer at Lincoln Park High School in Chicago.
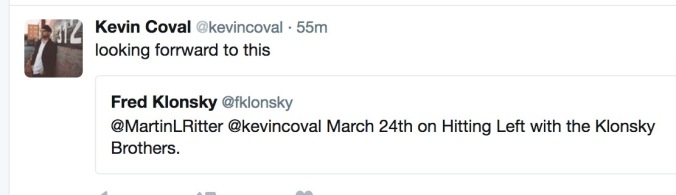
On March 24th we will be talking with poet Kevin Coval. Kevin’s book, A People’s History of Chicago, has just been released.
Also on March 24th my brother Mike Klonsky will have a conversation with education historian and corporate education reform critic Diane Ravitch.
Hitting Left can be heard live on Fridays at 11AM on www.lumpenradio.comon 105.5FM and live streaming.
A few hours later it is available on MixCloud.
You can download the podcast version of each show from Liberated Syndication and iTunes.

Past guests have included the head of the Chicago Principals Association Troy LaRaviere, Israeli peace activist Yonatan Shipira, Progressive Alderman and dean of the city council’s Hispanic Caucus Ricardo Munoz, Chicago Teachers Union President Karen Lewis, singer, songwriter, lawyer and activist Matt Farmer and 10th Ward Alderman Susan Sadlowski Garza.
Screen Shot 2017-03-15 at 10.55.13 AM


Teacher union collective bargaining is about the money and so much more.
Aspira charter teachers recently settled a contract. When CTU President Karen Lewis and former CTU leader – now Chicago alderman – Sue Sadlowski Garza appeared on our radio show, Hitting Left with the Klonsky Brothers, the conversation inevitably turned to the current upsurge in charter union drives and collective bargaining. Noble, Aspira and UNO are the three huge charter school chains in our c

YESTERDAY

The state may pass legislation to reduce or eliminate its subsidy for our Teachers Retirement Insurance Program (TRIP).
-Dave Davison, President, Illinois Retired Teachers Association It is March and many 2017 Activities of the IRTA and our Local Units are already underway. Our State Office is closely monitoring the activities over at the capital where the State Legislature is in session. Some local units have already met, and two IRTA State Committees have met-the rest soon will. Also two IRTA informational meeti
If you don’t like it when teachers work to the clock, why do you have us punch in and punch out?
Governor Rauner vetoed a $215 million payment to CPS earmarked for earned pensions. The Mayor through his surrogate CPS CEO Forrest Claypool has threatened to close schools two weeks early and called four furlough days