
Picture Post Week: Follow up on who’s running America’s charter schools
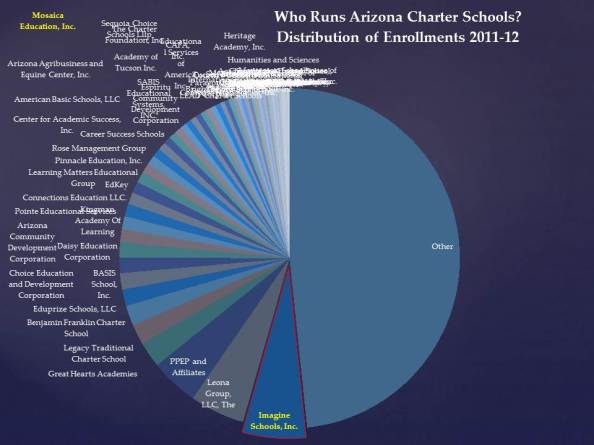
This post is a follow up on my previous post where I discussed which charter school operators are actually leading the nation in charter school enrollments. Here are a some slides breaking out the charter school enrollments by operator/manager for a handful of states. These slides are made possible by my meticulous graduate student Mark Weber, who spent hours aligning operator classifications and school links first presented by Gary Miron and colleagues, and merging those classifications to the 2011-12 National Center for Education Statistics Common Core of Data and Civil Rights Data Collections.
The data are likely imperfect in many ways. For one, It’s not always easy to figure out exactly who’s managing what school. In addition, charter school enrollments have continued to expand rapidly since this time. But, we have little reason to believe, for example, that the distribution of operators within the charter sector has shifted dramatically. Bottom line – we should have better – “officially” (USDOE/NCES, SEAs) gathered data on such things. For now, we don’t.
In later posts, I will, time permitting, spend a bit more time discussing some of the operators I’ve highlighted in red (w/yellow font) on these slides. My previous post includes some links and to some, these names will be familiar.


Picture Post Week: Who’s granting all of those education degrees?
This post is an update to a series of earlier posts in which I summarized the production of education degrees over time. As policymakers continue their critiques of the supposed decline in the quality of teacher preparation, as if teacher and leader preparation has been static since the 1950s, it’s worth again looking at trends of the last 20+ years to see just what has changed. The following graphs summarize undergraduate and graduate degree production classified by a) undergraduate institution selectivity as reported in Barron’s guides and b) institutional classifications from the 1994 Carnegie Classification system, which was more hierarchical (read: elitist) than later versions.

