Latest News and Comment from Education

Friday, July 26, 2019

National Charter School Advocacy Exec’s Lackluster State Advocacy Results | deutsch29

National Charter School Advocacy Exec’s Lackluster State Advocacy Results | deutsch29

National Charter School Advocacy Exec’s Lackluster State Advocacy Results

On July 19, 2019, West Virginia Public Broadcasting published a piece entitled, “Q&A: National Charter School Proponent Weighs in on W.Va.’s Education Bill.”The piece opens as follows:
Emily Schultz is the director for state advocacy and policy with the National Alliance for Public Charter Schools [NAPCS]. Lawmakers consulted her as they shaped the education reform bill recently signed into law that allows for the establishment of charter schools in West Virginia for the first time in the state’s history.
WV legislators consulted with national-level charter school advocacy director, Emily Schultz, for a bill on charter schools in WV.
The question is, what charter school notches does Schultz have in her corporate-modeled, school choice belt as evidence that her advice is based upon actual success in establishing charter schools?
WV Public Broadcasting includes this brief bio for Schultz, which links to her NAPCS bio:
Emily Schultz is the director for state advocacy and policy for the National Alliance for Public Charter Schools. Prior to joining the National Alliance, she served as the executive director of the Alabama Coalition for Public Charter Schools. 
Emily started her career in education as a second-grade teacher at Cascade Elementary in Atlanta through Teach for America. She is an Alabama native and has an undergraduate degree in Political Science and Educational Studies from Carleton College, and a Master in Education Policy from Stanford University.
Let’s expand upon Schultz’s bio a bit.
According to her Linkedin bio, Schultz has a lot of experience promoting corporate education reform. She was a “program manager” in DC from 2008 to CONTINUE READING: National Charter School Advocacy Exec’s Lackluster State Advocacy Results | deutsch29

Shanker Blog: The Role of States in Teacher Pay Gaps | National Education Policy Center

Shanker Blog: The Role of States in Teacher Pay Gaps | National Education Policy Center

Shanker Blog: The Role of States in Teacher Pay Gaps

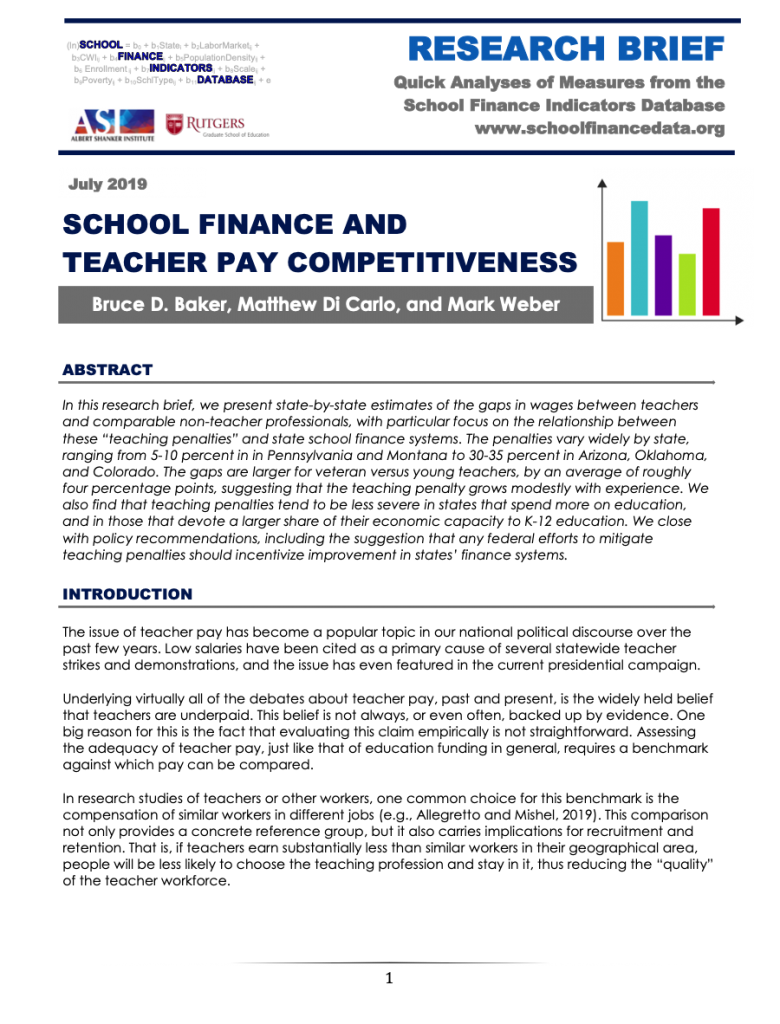
Image result for Brief: School Finance and Teacher Pay Competitiveness
We recently published a research brief looking at gaps in pay between teachers and comparable non-teacher professionals. These gaps are sometimes called “teaching penalties.” The brief draws on data from the School Finance Indicators Database (SFID), a collection of school finance and resource allocation measures published by the Shanker Institute and the Rutgers Graduate School of Education. 
The first part of the brief presents our estimates of teaching penalties, by state, for young (age 25) and veteran (age 55) teachers. We find that the gaps between teachers and similar non-teacher professionals range between 5-10 percent in states like Pennsylvania and Montana to 35-40 percent in Arizona, Oklahoma and Colorado (the latter three are all states in which there were recent major teacher strikes). To be clear, these estimates do not include benefits, although our rough calculations (discussed in the brief) suggest that the inclusion of benefits would not come close to closing these gaps in most states.
Our primary focus, however, is on the relationship between these teaching penalties and states’ school finance systems. 
Specifically, we find a significant relationship between the size of the penalties and adjusted state K-12 spending. In other words, states that spend more exhibit smaller gaps. We find a similar relationship between the penalties and states’ fiscal effort, which measures how much of their total “economic capacity” they spend on K-12 education – i.e., states that put forth more “effort” tend to have smaller gaps.
On the one hand, these findings are not surprising. A large proportion of state education spending goes to teachers’ salaries. So, teachers will tend to be better-paid in states that spend more, and will therefore earn wages that are more competitive with those of their non-teacher counterparts. Moreover, to be clear, we do not take any position on how additional funds to improve teacher pay, if allocated, should be distributed (e.g., across the board versus targeted raises).
On the other hand, our results illustrate a few important ideas underlying the eternal debates about the adequacy of teacher pay, debates that have gained new momentum in the wake of a recent proposal from a Democratic presidential candidate to supplement teacher pay with federal funds.
First, and most obviously, raising teacher pay to a more competitive level will require greater resources from some states than from others. Our results indicate that teacher/non-teacher pay gaps are substantial in virtually all states, but the magnitude of the problem varies considerably by state.
Second, policy matters in school finance when it comes to improving teacher pay. Teaching penalties vary between states for a variety of reasons, some of which may be peripheral to education policy – e.g., the composition of non-teacher workforces, collective bargaining laws, etc. But it is no accident that higher-effort, higher-spending states tend to have smaller teaching penalties. 
Third, and perhaps most importantly, what we’re showing here, put simply, is that some states are constrained in how much they can pay their teachers, whereas others seem to underpay teachers by choice – i.e., by refusing to raise sufficient revenue to properly fund their school systems. 
Mississippi, for example, exhibits a large teaching penalty – teachers in that state earn wages that are 23-27 percent lower than their non-teacher counterparts', depending on age. But that’s principally because Mississippi’s economy (economic capacity) is small, and despite their relatively high fiscal effort, they have trouble raising a lot of revenue. Put differently, Mississippi devotes a relatively large share of its economy to K-12 education, but its economy is so small that spending falls short.
By contrast, there are a number of other states, such as Arizona, Colorado and North Carolina, in which teaching penalties are among the largest in the nation, not because of a lack of economic capacity, but rather because these states put forth relatively low effort. That is, revenue – and therefore teachers’ salaries – is low due in part to deliberate policy choices.
From this perspective, regardless of how any federal efforts to improve teacher pay are distributed within states, we strongly recommend that they are designed to incentivize improvement in states’ funding systems. 
For instance, priority should be given to helping states like Mississippi, which is putting forth effort but falling short due to economic constraints. When it comes to low-effort states, however, federal funds should be partially contingent on improvements to finance policy in these states. 
Low teacher pay – and insufficient education funding, in general – are due to state-level choices and the ultimate focus should therefore be on state-level reform. The federal government should not be subsidizing states that can help themselves but have refused to do so. 
This blog post has been shared by permission from the author.
Readers wishing to comment on the content are encouraged to do so via the link to the original post.
Find the original post here:


The views expressed by the blogger are not necessarily those of NEPC.
Shanker Blog: The Role of States in Teacher Pay Gaps | National Education Policy Center

Thursday, July 25, 2019

Growing Scandal at Sacramento School District: Additional Email Reveals More Deception - Sacramento City Teachers Association

FCMAT Emails Show District Deceived Community - Sacramento City Teachers Association

Growing Scandal at Sacramento School District:

Additional Email Reveals More Deception, Hiding Facts and Fiscal Mismanagement From the Public 

District aware of $7 million per year windfall due to undercounting students on April 1,
but pushed ahead with layoffs in May and higher class sizes for students

Link Available Here to the Sacramento City Teachers Association Website
 
Sacramento, July 25, 2019– A recently-obtained email from Sacramento City Unified School District (SCUSD) Superintendent Jose Aguilar – in addition to those released last week – shows a growing scandal at the district.

Emails, sent in March, discovered by the Sacramento City Teachers Association (SCTA) through a public documents request, released last week, show that the Sacramento City Unified School District (SCUSD) ignored warnings from a state of California fiscal monitor about false and misleading budget data.

An additional email, dated April 1, also discovered by SCTA, from Aguilar to Sacramento County Education Superintendent David Gordon shows that top SCUSD officials knew as early as April 1 that they had undercounted enrollment by 730 students, resulting in $7 million in additional funds available in each of the next two school years, and in subsequent years.

Despite availability of these funds, Aguilar and SCUSD officials knowingly deceived the community, including some school board members, about its financial condition. The misleading data was used to justify important decisions, including the layoff of hundreds of teachers and other school employees in May. Hundreds of teachers and staff were sent pink slips. The district refused to honor its contract with SCTA resulting in a strike by educators.

Later the district acknowledged that instead of a projected $54 million negative ending fund balance for 2020-21, it would have a surplus of $15 million—a $69 million turnaround.

In March, Mike Fine of the state of California’s Fiscal Crisis and Management Assistance Team wrote in an email to SCUSD Superintendent Jorge Aguilar and board President Jessie Ryan that“[Y]our staff has again demonstrated that they don’t have the capacity or willingness to produce accurate data.” Sacramento Mayor Darrell Steinberg also was copied on the email correspondences.

Fine informed SCUSD officials in writing that he has “no confidence’ in the district’s business staff. At the time these emails were written district officials had claimed that SCUSD was on the brink of a state takeover.

The additional emails and those released last week indicate that district officials knew much earlier that the information that they were sharing with the community was not accurate.

The March email exchange was reported last week in the Sacramento Bee . Copies of the emails, including the April 1 email, can be found here on the SCTA website. 

With 40,000 students, the Sacramento City Unified School District is the 13th largest school district in California. The Sacramento City Teachers Association is an affiliate of the California Teachers Association and the National Education Association.
About the Sacramento City Teachers Association
Since 1921, the Sacramento City Teachers Association has represented teachers, school nurses, psychologists, language speech and hearing specialists, social workers, librarians and other certificated professionals who work for the Sacramento City Unified School District. SCTA represents 2800 professional educators.
Sacramento City Teachers Association
 5300 Elvas Avenue | 916.452.4591
www.sacteachers.org


FCMAT Emails Show District Deceived Community - Sacramento City Teachers Association


Big Education Ape: UPDATE: Sacramento City Unified officials slammed by fiscal adviser | The Sacramento Bee #REDFORED #SCTA #SCUSD #CTA - https://bigeducationape.blogspot.com/2019/07/sacramento-city-unified-officials.html

Inside Betsy DeVos’ Billions: Just How Rich Is The Education Secretary?

Inside Betsy DeVos’ Billions: Just How Rich Is The Education Secretary?

Inside Betsy DeVos’ Billions: Just How Rich Is The Education Secretary?

This is the fifth in a series that explores the personal fortunes of President Trump’s cabinet officials. See more on Mike PenceWilliam BarrSteven Mnuchin and Wilbur Ross.
Among Donald Trump’s historically rich cabinet members, Betsy DeVos is the richest. But for more than two years, the extent of her finances has been a mystery. Now Forbes has zeroed in on the root of the DeVos family fortune, Amway, to come up with what we believe is the most realistic estimate of the size of her fortune published so far. Together, Betsy DeVos, her husband and their four adult children are worth roughly $2 billion.
The key to untangling DeVos’ empire appears to lie in Securities and Exchange Commission filings from the late 1990s and early 2000s, when Amway’s Asia-Pacific business operated through a publicly traded subsidiary. Those documents indicate that Betsy’s husband Dick DeVos and his three siblings had equal interests in the subsidiary, an indication that they equally split their ownership of the rest of Amway. Given that his parents have both passed away and the DeVos family continues to own half of the business, it seems reasonable to assume that Betsy, her husband and their kids now control one quarter of the family’s stake, or about 12% of Amway. That share is worth an estimated $1.3 billion.
Assuming they also own 25% of the family’s second-largest asset, the Orlando Magic basketball team, that’s another $300 million or so. Their slice of the family’s portfolio of commercial real estate, private equity investments, mansions and yachts makes up the rest of the education secretary’s net worth.

Betsy's Billons

Betsy DeVos is the richest member of Donald Trump's cabinet. She, her husband and their four adult children are worth an estimated $2 billion—mostly in Amway stock.


Betsy, the daughter of auto parts magnate Edgar Prince and sister of Blackwater founder Erik Prince, owes the vast majority of her fortune to her marriage to Dick DeVos. His father, Richard DeVos Sr., cofounded Amway in 1959 alongside his high school friend, Jay Van Andel. What began as two buddies selling an all-purpose cleaner door-to-door quickly grew into an army of independent salespeople hawking vitamins, soaps and other household goods to friends and family—and, controversially, earning money by signing others up as distributors too. Dick DeVos ran the company from 1993 to 2002. Today one DeVos (Dick’s brother Doug) and one Van Andel co-chair the board. The families split ownership 50/50, according to a spokesperson of the DeVos family. CONTINUE READING: Inside Betsy DeVos’ Billions: Just How Rich Is The Education Secretary?


Does Twitter’s new design make you grumpy? Use this extension to turn back time | Digital Trends #newtwitter #newtwitterdesign

Craving the Old Twitter Design? This Browser Extension Will Help | Digital Trends

Does Twitter’s new design make you grumpy? Use this extension to turn back time

Twitter for desktop now looks a bit more like the Twitter app — but not everyone is in love with the new design. For the change-wary users already referring to Twitter’s “good old days,” there’s a new browser extension that will make Twitter.com look like, well, Twitter again.
he new Mozilla Firefox add-on GoodTwitter forces the web browser to return back to Twitter’s previous design. As an OpenSource extension, the free download adjusts browser requests so that, on Firefox, Twitter looks like the more familiar social network. 
The extension, created by user Zusor, is already in version 1.7 after launching just a few days after the new design began rolling out. It also fixes a few bugs from the original extension, including the inability to copy and paste. The extension now has a 4.7 star rating.
Along with adapting a more app-like look, Twitter’s redesign rearranges the desktop home page. The top navigation bar is gone, replaced by navigation options on the left-hand side, while standards like trends and “who to follow” jump over to the opposite side. The redesign also brings Explore from the mobile app to desktop, along with the bookmark option
One of the most anticipated updates, however, launched without replacing the old CONTINUE READING: Craving the Old Twitter Design? This Browser Extension Will Help | Digital Trends
Hate Twitter’s new design? Here’s how to get the old look back - https://thenextweb.com/?p=1232095 by @Mixtatiq on @thenextweb


Dissent within statewide task force adds tension to California’s charter school debate | EdSource

Dissent within statewide task force adds tension to California’s charter school debate | EdSource

Dissent within statewide task force adds tension to California’s charter school debate

There was disagreement over which proposals to forward to Gov. Newsom


Sitting on Gov. Gavin Newsom’s desk is a document that has added fuel to the roiling debate over legislation that would limit the growth of charter schools in California.
Newsom hasn’t taken a public position on the 13-page report by the California Charter School Policy Task Force, which he asked State Superintendent of Public Instruction Tony Thurmond to convene.
But the four members affiliated with charter schools on the 11-member task force say they’re concerned that the report misconstrues what the group supported. They are particularly critical of a package of proposals that Thurmond presented to the task force, put to a vote and then included in the report. Thurmond ran the task force meetings and oversaw the writing of the report.
Thurmond dismissed the criticisms as off-base and defends the wording of the report and the decisions behind it. Some committee members agree with him.


The disagreement highlights the struggle Newsom and the Legislature are having as they determine the future role and growth of charter schools. California has more than 1,300 charter schools. They serve more than 10 percent of the state’s 6 million public school students.
During the next two months, Newsom’s advisers, charter school advocates and detractors will be negotiating language in Assembly Bill 1505, which could substantially restrict charter school growth. Its author, Assemblyman Patrick O’Donnell, D-Long Beach, and its co-sponsor, the California Teachers Association, are citing some of the contentious proposals in the task force report to support their positions. Their ability and that of charter advocates to sway public opinion on charter school reform could shape a potential deal on the legislation.
Earlier this year Newsom asked Thurmond to create the task force and report back by July 1 on two key issues: how to weigh a charter school’s fiscal impact on school districts and how to change the way a school receives authorization to operate.
In consultation with the governor’s office, Thurmond appointed representatives from both sides of the charter controversy. The task force’s meetings were not open to the public, with Thurmond’s staff taking notes but with no formal minutes.
EdSource reached out to all 11
members and spoke with the eight who responded. They differ on some pivotal details.
After meeting weekly for nearly three months, the task force issued a report with 13 proposals considered by the group: four recommendations, listed first, reached by CONTINUE READING: Dissent within statewide task force adds tension to California’s charter school debate | EdSource

Big Education Ape: Hired Guns, Scholars and the California School Policy Task Force | tultican - http://bigeducationape.blogspot.com/2019/06/hired-guns-scholars-and-california.html


Milliken v. Bradley: Supreme Court Case Has Helped Keep Schools Segregated : NPR

Milliken v. Bradley: Supreme Court Case Has Helped Keep Schools Segregated : NPR

This Supreme Court Case Made School District Lines A Tool For Segregation

Roughly 9 million children — nearly 1 in 5 public school students in the U.S. — attend schools that are racially isolated and receive far less money than schools just a few miles away. That's according to a sweeping new review of the nation's most divisive school district borders from EdBuild, a nonprofit that investigates school funding inequities.
"Inequality is endemic" in America's public schools, the report says, identifying nearly 1,000 school district borders where schools on one side receive at least 10% less money per student than schools on the other side and where the racial makeup of the two sides' students varies by 25 percentage points or more. It is the story of segregation, in 2019.
EdBuild says the disadvantaged districts in these cross-district comparisons receive, on average, about $4,200 less per student than their wealthier neighbors, largely because of differences in what they're able to raise through local property taxes. To put that gap into perspective, schools spent an average of $12,000 per student in 2017, according to the U.S. Census Bureau. This means that disadvantaged districts have about one-third fewer dollars per student than their peers up the street.


Imagine you're a principal with one-third less funding to pay for teachers, textbooks, buses and counselors.
Now imagine you're a child living at the center of that inequity.
"You know it as soon as you look at the school. You know it the minute you walk into a classroom," says Rebecca Sibilia, EdBuild's founder and CEO, of these funding differences. "There are kids who see this every day, and they understand."
They understand, Sibilia says, that the scales are tipped against them. Their schools are still segregated and underfunded more than 60 years after the Supreme Court issued one of its most famous rulings, in Brown v. Board of Education, unanimously CONTINUE READING: Milliken v. Bradley: Supreme Court Case Has Helped Keep Schools Segregated : NPR

Jersey Jazzman: What's Really Happening In Camden's Schools

Jersey Jazzman: What's Really Happening In Camden's Schools

What's Really Happening In Camden's Schools

This latest series on Camden's schools is in three parts:

Part I

Part II

Part III (this post)


I want to wrap up this series of posts about Camden's schools with a look at the latest CREDO report, which the supporters of recent "reforms" keep citing as proof of those reforms' success.

Long time readers know the CREDO reports, issued by the Center for Research on Education Outcomes at Stanford University, have been perhaps the best known of all research studies on the effectiveness of charter schools. The reports, which are not peer-reviewed, look at the differences in growth in test scores between charter schools and public district schools, or between different school operators within the charter sector. CREDO often issues reports for a particular city's or state's charter sector; they last produced a statewide report for New Jersey in 2013.

I and others have written a great deal over the years about the inherent limitations and flaws in CREDO's methodology. A quick summary:

-- The CREDO reports rely on data that is too crude to do the job properly. At the heart of CREDOs methodology is their supposed ability to virtually "match" students who do and don't attend charter schools, and compare their progress. The match is made on two factors: first, student characteristics, including whether students qualify for free lunch, whether they are classified as English language learners (in New Jersey, the designation is "LEP," or "limited English proficient"), whether they have a special education disability, race/ethnicity, and gender.

The problem is that these classifications are not finely-grained enough to make a useful CONTINUE READING: 
Jersey Jazzman: What's Really Happening In Camden's Schools

How segregation keeps students of color out of richer nearby districts - Vox

How segregation keeps students of color out of richer nearby districts - Vox

How segregation keeps poor students of color out of whiter, richer nearby districts
See how your local school district compares.

Much of the conversation about school segregation in America is about how to lessen segregation within a school district, ensuring students of all races in the same district can study together in the same school.
That’s the kind of policy Joe Biden opposed in the 1970s, which he was called out for during the first Democratic presidential debates. These policies tried to ban federal courts from forcing districts to bus children from one neighborhood to another to desegregate schools.
But many districts are so segregated that they can’t be integrated just by moving students around within their borders. School district boundaries that draw a sharp line between two separate and unequal districts — one majority-white and well-funded, one nonwhite and underfunded — are quite common in the United States.
Here’s the border that separates two school districts in Connecticut — Lebanon and Windham.


Lebanon is 90 percent white, and it spends about $22,000 per pupil each year. Windham is about 25 percent white, and it spends $3,000 less per pupil than Lebanon.
There are nearly 1,000 borders like this in the US, according to a new report from the education nonprofit EdBuild. It looked for bordering districts where there was at least a 25 percentage-point gap in white students, as well as at least a 10 percent gap in funding.


On the disadvantaged side of the border, there are nearly 9 million students who attend schools that are, on average, 65 percent nonwhite. These schools received about $13,000 per pupil.


On the advantaged side, there are nearly 3 million students who attend schools that are, on average, 25 percent nonwhite. These schools receive about $17,000 per pupil.
And there are about 133 borders that are extremely unequal, with a 50 percentage-point difference in nonwhite students and a 20 percent funding gap.
By talking about integration only in the context of what happens within school districts, “We’re missing an entire part of this debate,” EdBuild CEO Rebecca Sibilia said.
Truly integrated schools would require integration between districts. But 45 years ago, the courts made this exceedingly hard.

Is your district one of the disadvantaged? Or advantaged?

The map below shows every American district on either side of one of these borders.
We’ve zoomed into your area to give you a better look, but you can explore the entire US. CONTINUE READING: How segregation keeps students of color out of richer nearby districts - Vox