PHOTOS: Where The Kids Across Town Grow Up With Very Different Schools
On one side of the line — fresh paint and computer labs.
Across that line? Old textbooks, broken chairs and, above all, many more students of color.
Decades after Brown v. Board supposedly ended segregated schooling, these boundaries show a country where education remains deeply divided and unequal.
"You know it as soon as you look at the school. You know it the minute you walk into a classroom," says Rebecca Sibilia, the founder and CEO of EdBuild. Her organization has a new report on the pervasive inequality in U.S. schools. "There are kids who see this every day, and they understand."
Across the country, racist housing policies created segregated neighborhoods. And because many schools in the U.S. are funded locally, through property taxes or other funds, school districts with wealthier residents are able to funnel money to their schools. Neighboring school districts miss out.
Additional money from state and the federal governments is meant to close these local funding gaps, but it's seldom enough.
Decades after Brown, housing segregation combined with this funding model have entrenched what EdBuild calls "racially isolated" school systems. In nearly 1,000 communities, according to EdBuild, one school district directly abuts a district that differs dramatically by racial makeup and spending per student.
Almost 9 million students attend these underfunded, racially isolated districts.
NPR sent photographers to several of them across the country to document the stark differences across these borders.
This is what they saw.
Stark differences, in black and white
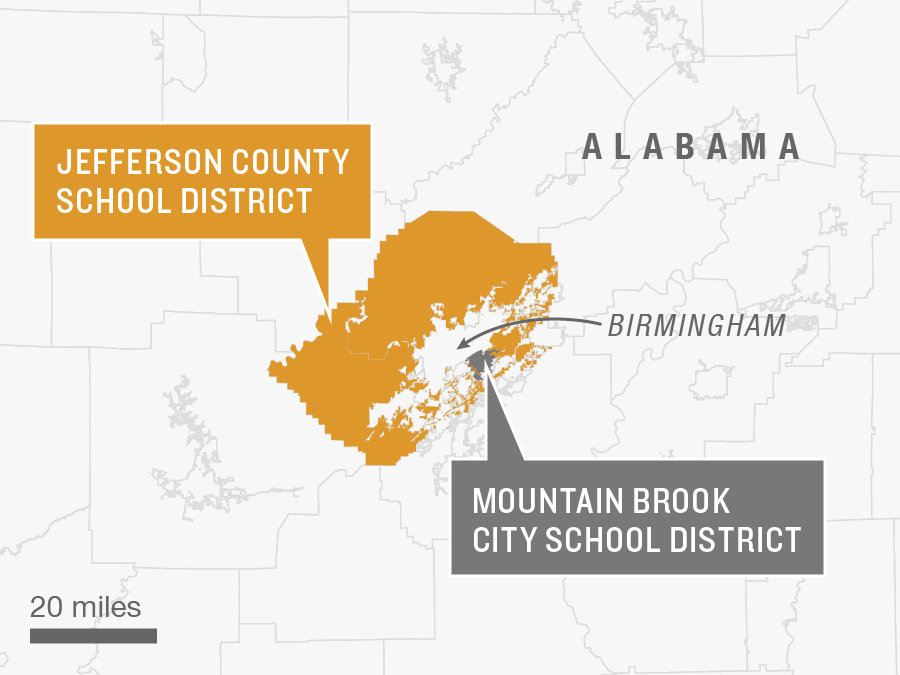
JEFFERSON COUNTY SCHOOLS / MOUNTAIN BROOK CITY SCHOOL DISTRICT
OUTSIDE BIRMINGHAM, ALA.

JEFFERSON COUNTY MOUNTAIN BROOK CITY Enrollment 36,171 4,343 Total revenue per pupil $9,220 $14,327 Percent nonwhite 58% 4% Poverty rate 17% 6% Median household income $27,932 $70,625 Owner-occupied median property value $134,400 $578,100

| JEFFERSON COUNTY | MOUNTAIN BROOK CITY | |
|---|---|---|
| Enrollment | 36,171 | 4,343 |
| Total revenue per pupil | $9,220 | $14,327 |
| Percent nonwhite | 58% | 4% |
| Poverty rate | 17% | 6% |
| Median household income | $27,932 | $70,625 |
| Owner-occupied median property value | $134,400 | $578,100 |
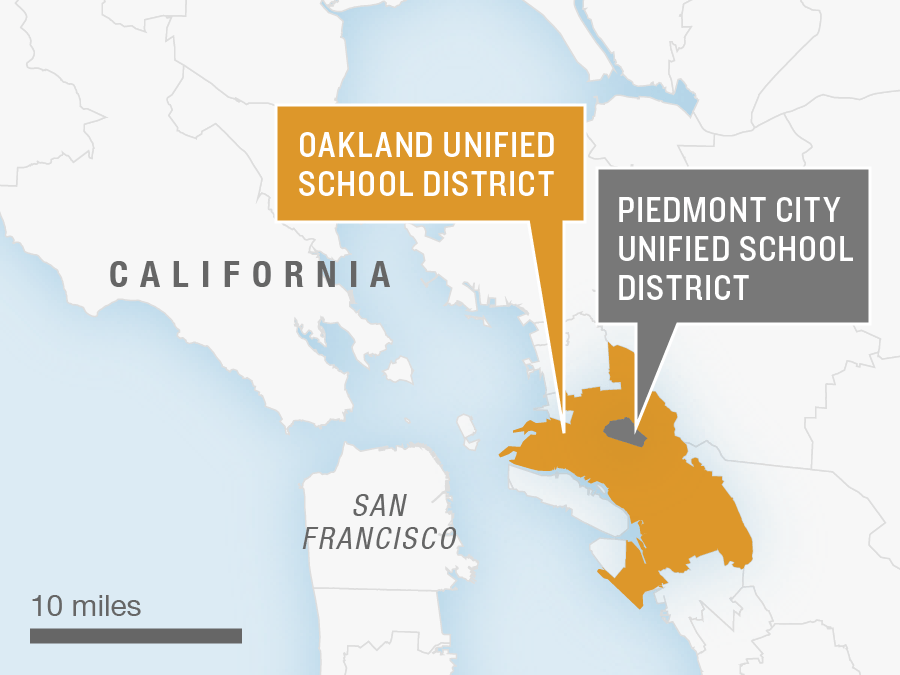
An island of wealth surrounded by the city of Oakland
OAKLAND UNIFIED SCHOOL DISTRICT / PIEDMONT CITY UNIFIED SCHOOL DISTRICT
NORTHERN CALIFORNIA

OAKLAND PIEDMONT CITY Enrollment 49,760 2,692 Total revenue per pupil $12,721 $17,725 Percent nonwhite 90% 40% Poverty rate 18% 2%

| OAKLAND | PIEDMONT CITY | |
|---|---|---|
| Enrollment | 49,760 | 2,692 |
| Total revenue per pupil | $12,721 | $17,725 |
| Percent nonwhite | 90% | 40% |
| Poverty rate | 18% | 2% |
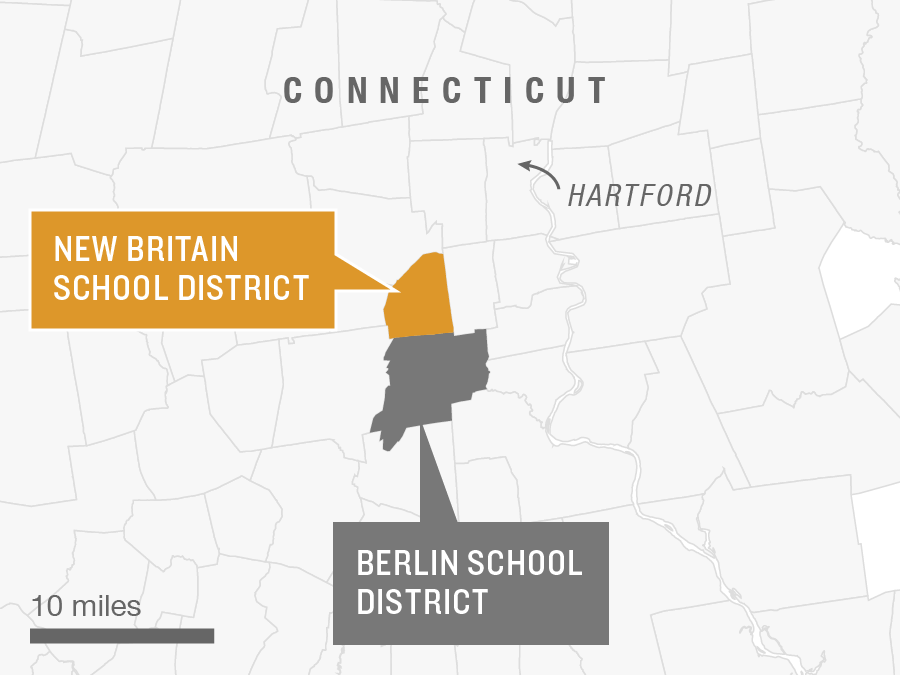
In Connecticut, one district "eclipsed" by its neighbor
NEW BRITAIN SCHOOL DISTRICT / BERLIN SCHOOL DISTRICT
HARTFORD, CONN.

NEW BRITAIN BERLIN Enrollment 10,065 2,791 Total revenue per pupil $16,251 $21,579 Percent nonwhite 80% 18% Poverty rate 31% 5% Median household income $43,611 $93,328 Owner-occupied median property value $156,800 $281,100

| NEW BRITAIN | BERLIN | |
|---|---|---|
| Enrollment | 10,065 | 2,791 |
| Total revenue per pupil | $16,251 | $21,579 |
| Percent nonwhite | 80% | 18% |
| Poverty rate | 31% | 5% |
| Median household income | $43,611 | $93,328 |
| Owner-occupied median property value | $156,800 | $281,100 |
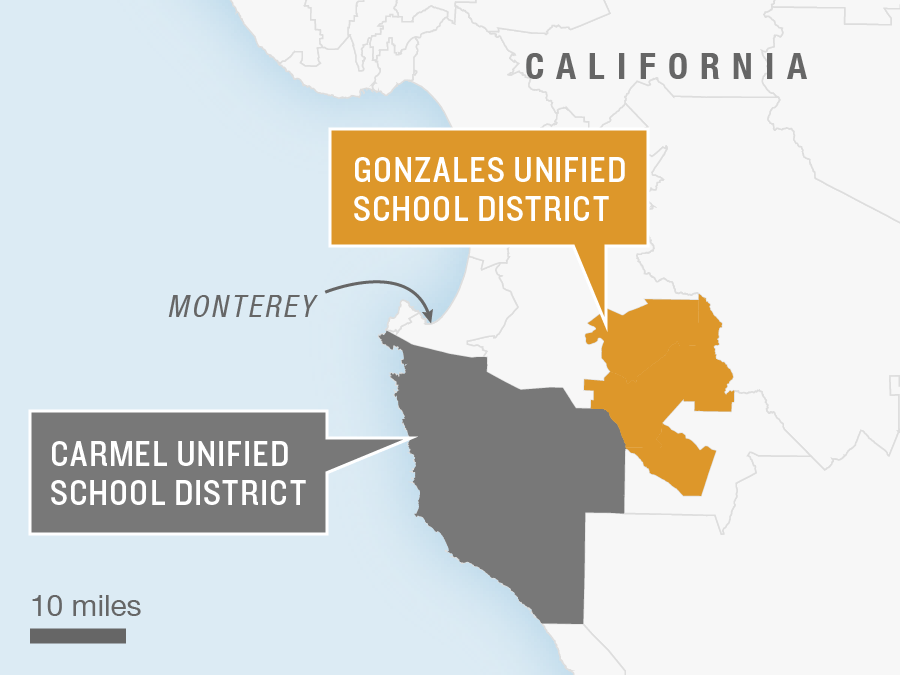
The California coastline, marked by inequality
GONZALES UNIFIED SCHOOL DISTRICT / CARMEL UNIFIED SCHOOL DISTRICT
CARMEL, CALIF.

GONZALES CARMEL Enrollment 2,424 2,509 Total revenue per pupil $12,341 $24,183 Percent nonwhite 98% 38% Poverty rate 18% 6% Median household income $52,656 $90,492 Owner-occupied median property value $325,700 $1,073,700

| GONZALES | CARMEL | |
|---|---|---|
| Enrollment | 2,424 | 2,509 |
| Total revenue per pupil | $12,341 | $24,183 |
| Percent nonwhite | 98% | 38% |
| Poverty rate | 18% | 6% |
| Median household income | $52,656 | $90,492 |
| Owner-occupied median property value | $325,700 | $1,073,700 |

